Trading Week Ahead: FOMC Meeting Week Is Here

Heading into a new trading week, weak US jobs data has cooled Fed rate hike bets, but Middle East tensions are keeping Brent above $100 and yields elevated. With the USD in focus, US services data and the FOMC minutes could set the tone, so plan your levels and manage your risk.
- 👉 US ISM Non-Manufacturing PMI
- Services activity is expected to cool slightly, with the forecast at 55.1 versus 55.4 previously. A reading above 50 signals expansion, so a surprise either way could move the USD.
- 👉 US ISM Non-Manufacturing Prices
- The previous reading was 72.6, the highest since August 2022. Another elevated print would keep inflation worries alive and could challenge the idea that the Fed is done with hikes.
- 👉 FOMC Meeting Minutes
- The minutes cover the 15 to 16 September meeting, so they will not reflect Friday’s weak jobs report. Traders will look for how divided policymakers are on inflation versus employment and how open they are to another move.

| Date | Time | Instrument | Event |
|---|---|---|---|
| 05/10/26 |
15:45
|
USD
|
S&P Global Services PMI |
|
16:00
|
USD
|
ISM Non-Manufacturing Prices | |
|
USD
|
ISM Services PMI | ||
| 07/10/26 |
20:00
|
USD
|
FOMC Meeting Minutes |
*All times in the table are in CEST.
Technical Analysis with FVG Strategy
This technical analysis uses the EMA 20 and EMA 50 to determine market trends, alongside volume analysis (VPOC) and the Fair Value Gap (FVG), which refers to price imbalances caused by aggressive movements, signalling key entry and exit points. This strategy applies to EURUSD, GBPJPY, Bitcoin, and XAUUSD, providing insights into both last week’s market opportunities and the current ones.
Opportunities to Watch This Week
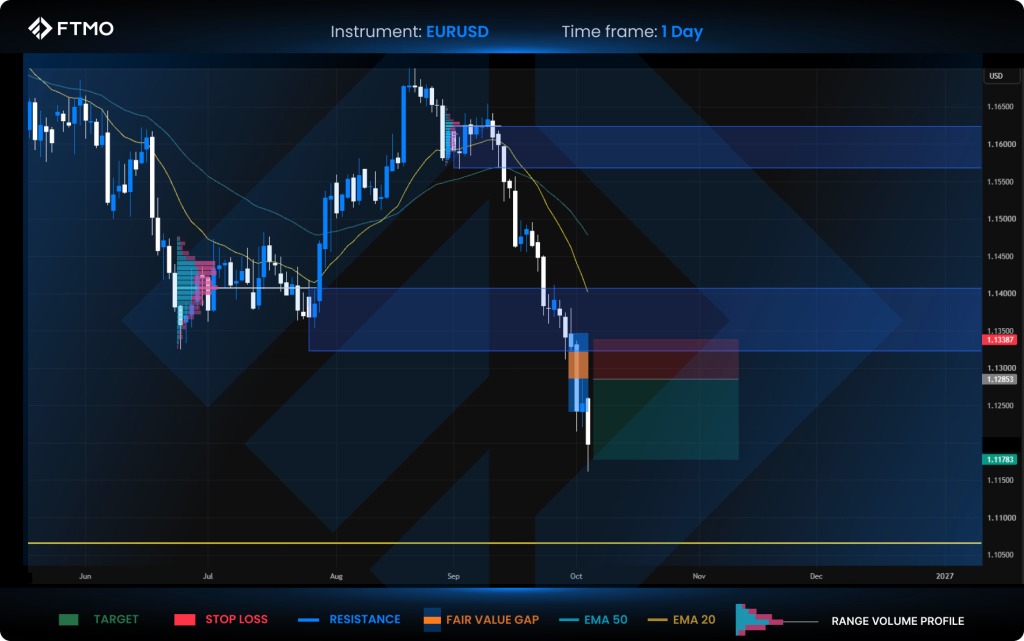
EURUSD
Market Context: The Euro continues to slide below the 1.13 level. Price closed below several key support levels and remains well beneath both the 20 and 50 EMAs, signaling a clear and ongoing bearish trend. Currently, there are no major structural support zones on the chart obstructing further downside progression.
Bearish Scenario (Preferred): A continuation of the dominant bearish trend following a corrective pullback into the active short FVG. The downside target extends toward the marked weekly swing liquidity pool (yellow line).
Bullish Scenario (Alternative): A short-term cooling-off phase or a daily close above resistance, which would shift the market structure back toward a bullish bias. However, there are currently no technical indications of a reversal on the chart.
FVG Setup: A bearish FVG has formed and is valid for execution, offering a potential baseline target of 2:1 RRR or an extended run down to the weekly swing liquidity (yellow line).
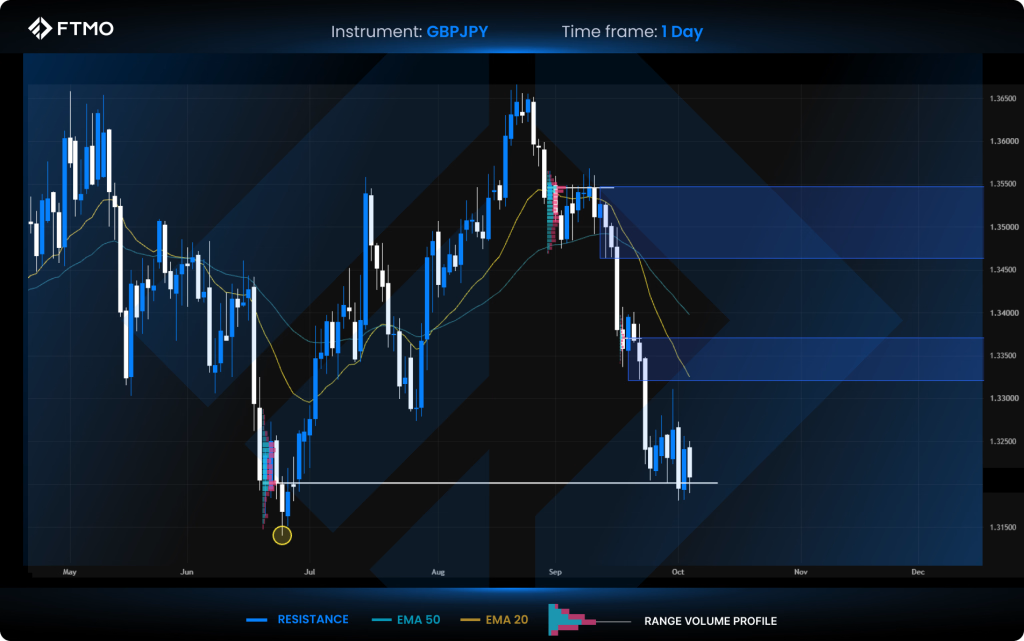
GBPJPY
Market Context: Price action halted at the VPOC range, where it has been consolidating since late September without continuing its downside trajectory. Despite this rotational phase, technical analysis indicates the market remains in a broader bearish trend, with price respecting the upper boundary of the recent short FVG and trading significantly below both EMAs.
Bearish Scenario (Preferred): A continuation lower; however, a confirmed daily close beneath the VPOC range is recommended to fully validate further downside momentum.
Bullish Scenario (Alternative): A corrective rally to test the overhead resistance zone.
FVG Setup: No FVG setup formed this week due to the tight rotational price action within the range.
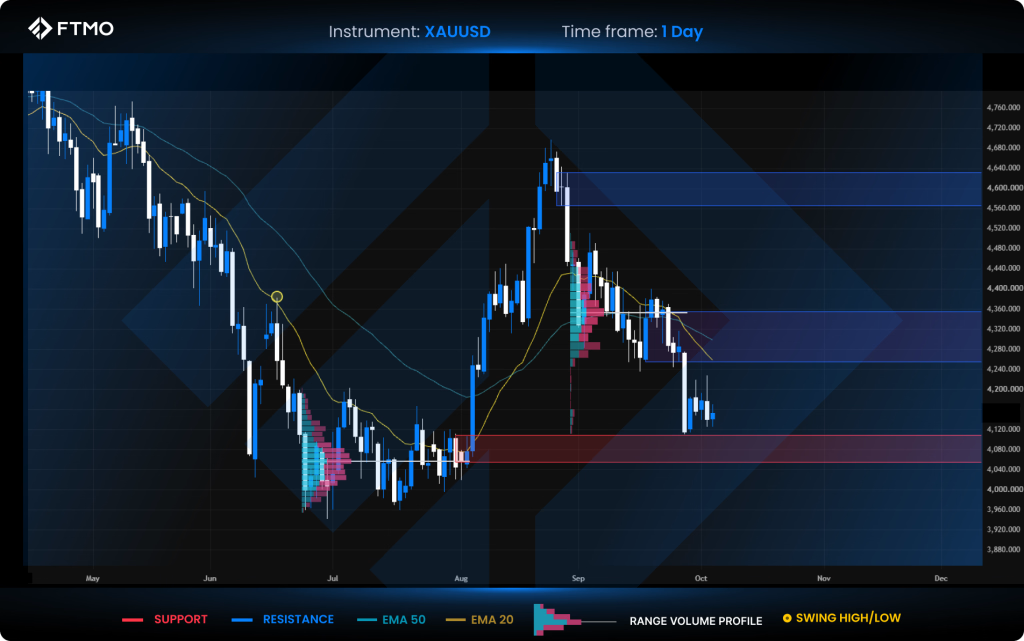
XAUUSD
Market Context: Gold reacted positively to its lower support floor, leaving further bearish continuation unconfirmed for now. Price is currently holding this support level along with the lower boundary of the active short FVG.
Bearish Scenario (Preferred): Downward continuation; however, a confirmed daily close below the support level is required to validate the next leg lower.
Bullish Scenario (Alternative): A relief rally into overhead resistance, where selling activity is expected to re-emerge.
FVG Setup: No FVG setup formed this week.
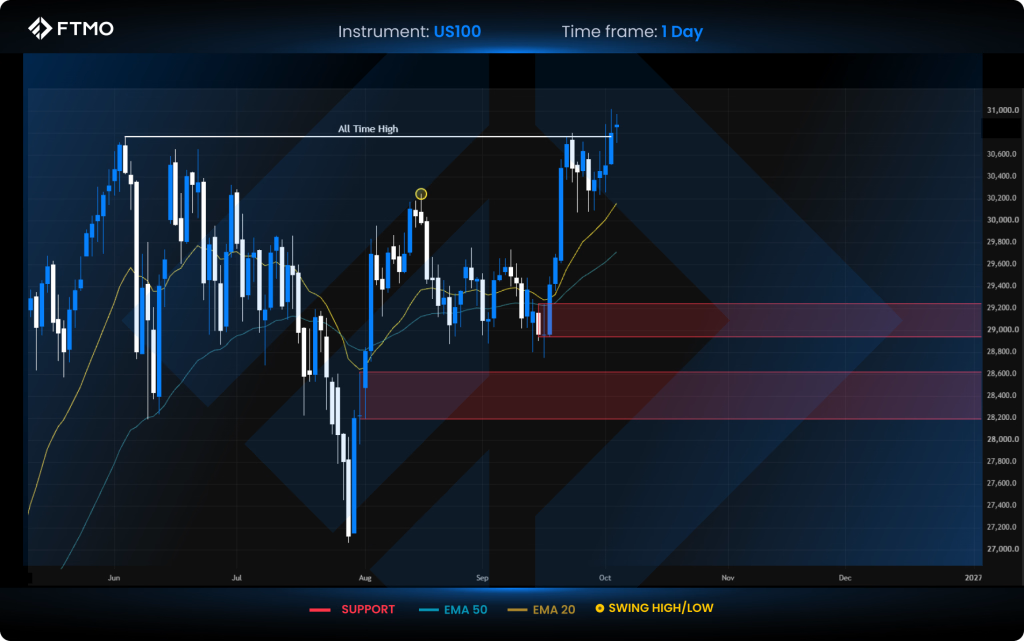
US100
Market Context: Two weeks ago, the index printed a new All-Time High (ATH), followed by a brief pullback, a standard market reaction after sweeping significant liquidity at a major structural level. Price has since broken decisively above the previous ATH and is pushing into fresh record highs.
Bullish Scenario (Preferred): A direct continuation of the upward momentum into price discovery.
Bearish Scenario (Alternative): A short-term cooling-off period leading to a pullback into the VPOC range of the recent consolidation.
FVG Setup: No FVG setup formed on the daily chart. Traders can monitor lower timeframes for trend-following entries aligned with the preferred bullish bias.
All information provided herein is intended solely for educational purposes related to trading on financial markets and does not constitute investment advice or serve in any way as a specific investment recommendation. Please read the full disclosure here.


Related






- As many Free Trials as you need
- Up to $200,000 account
- No time limit

- Unlimited Evaluation Accounts
- Trade with up to 3 Sim-Funded accounts
- Up to $450,000 in simulated capital
- Keep up to 90% of your simulated profits


Worldwide Reviews