Top 7 indicators and add-ons for cTrader
In addition to the MetaTrader platform, FTMO also allows traders to use the cTrader platform. Due to the many indicators and analytical tools, this platform is also very popular among traders. One of the advantages of cTrader is its openness, which allows traders to add various features and enhancements that can make trading much more efficient. Take a look at our selection of 7 interesting indicators and add-ons.
After describing some interesting indicators and add-ons for MetaTrader in the previous article, we will show you similar improvements for cTrader as well. The latter looks more modern and appeared on the market after the launch of MetaTrader 5. It contains many indicators and features already in the base, but one of the main advantages of the latter is the ability to add various enhancements, indicators and add-ons that can make trading much easier.
In contrast to MetaTrader, the new features can be programmed in C# and can also be used with MS Visual Studio, which could be an advantage for many traders with programming skills. Many add-ons are available directly from cTrader.com and an advantage for the thrifty trader is the fact that, as with MT4 and 5, a large number of add-ons can be downloaded for free. Installing add-ons is also easy, just double-click on the downloaded file and it will install automatically. You will then find it in the indicators window under Custom Indicators.
Order Flow Ticks
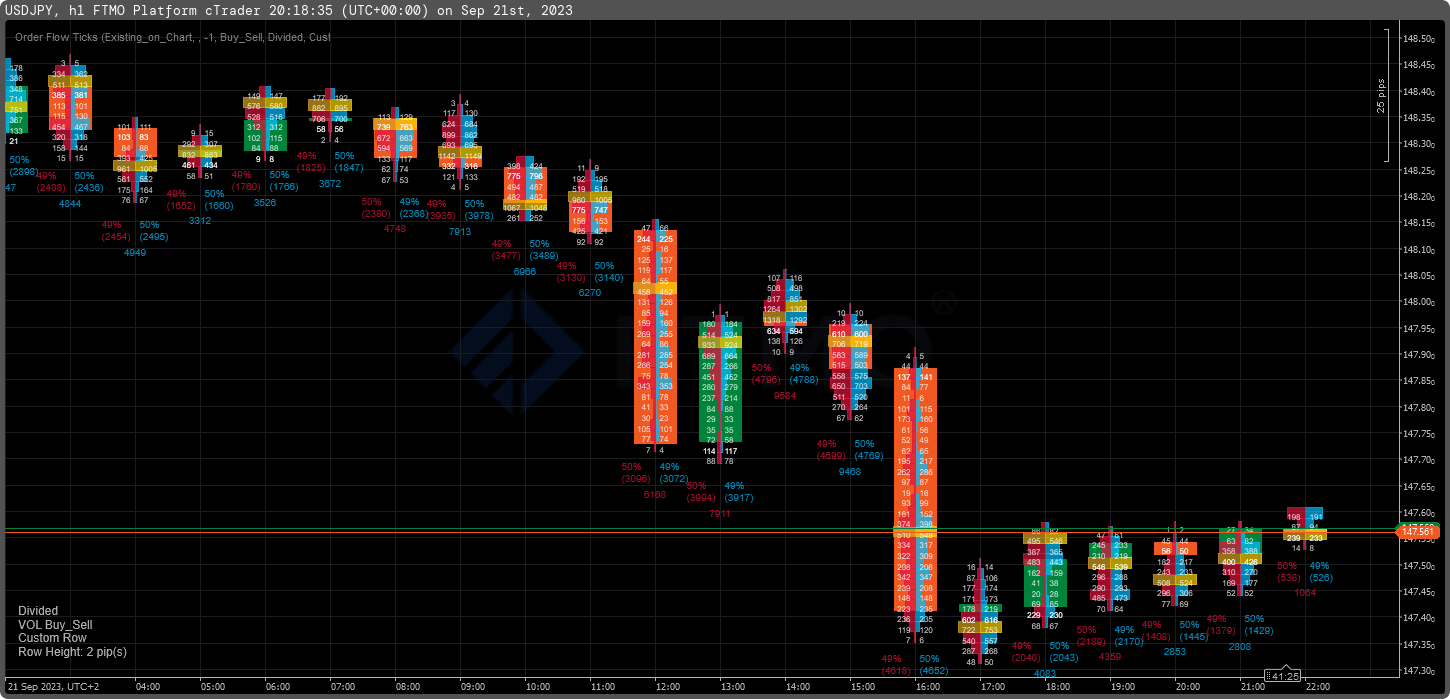
This indicator allows us to display additional information on the chart provided by the Order Flow, in this case, adjusted to tick volume. Order Flow, like the Volume Profile or Market Profile approach, is a very interesting addition that, unlike other common indicators, gives the trader the opportunity to find out why the price behaves this way at certain price levels.
The indicator offers a fairly wide range of display settings. If you spend a little time with this setup, it can be a very interesting extension that allows you to look at the price development from a different perspective.
Renko Wicks
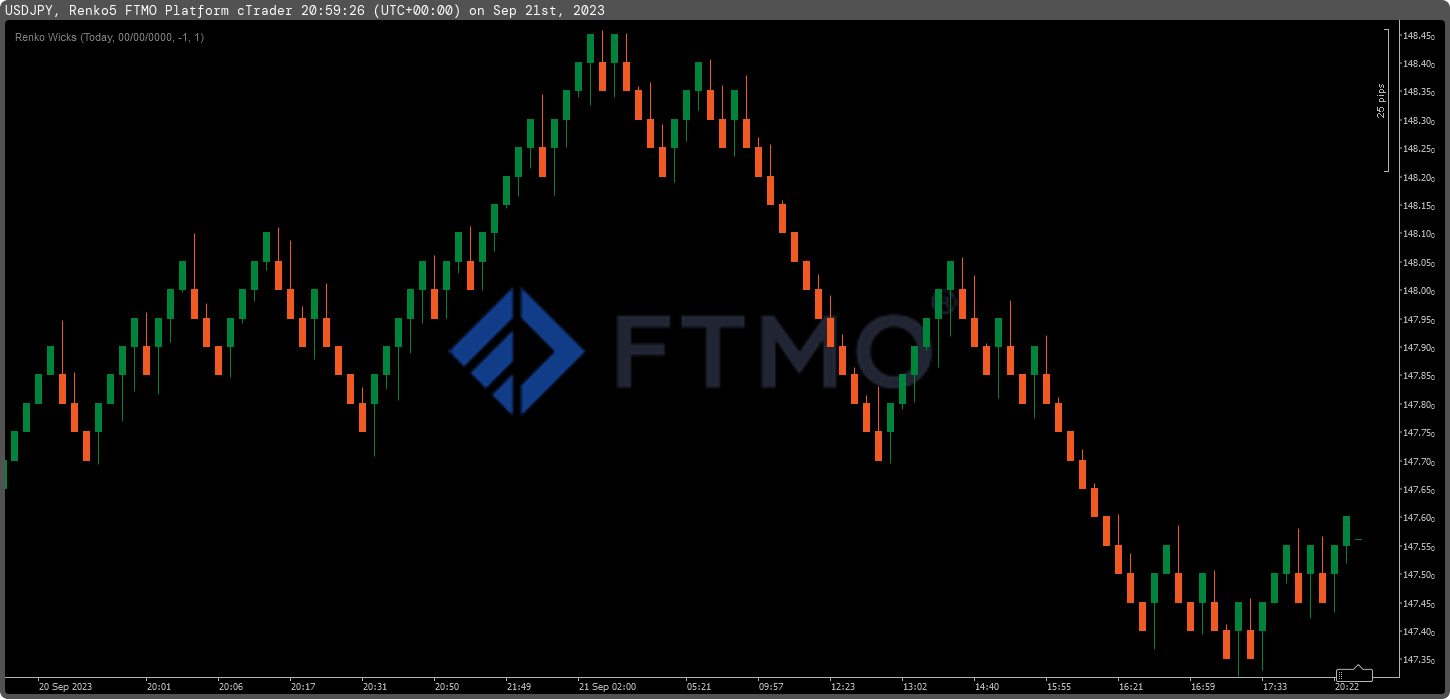
The author of the previous indicator is very active in creating add-ons for cTrader and offers traders several other interesting solutions. One of them, for example, is an "improvement" of the so-called Renko chart, which adds wicks to the classic bricks and removes one of the disadvantages of this type of chart.
More specifically, it adds a wick to the bull brick that indicates the minimum price during the creation of the brick, and adds a wick to the bear brick that indicates the maximum price during the creation of the brick. This is an interesting addition for those who use Renko charts for their trading.
Forex Market Hours
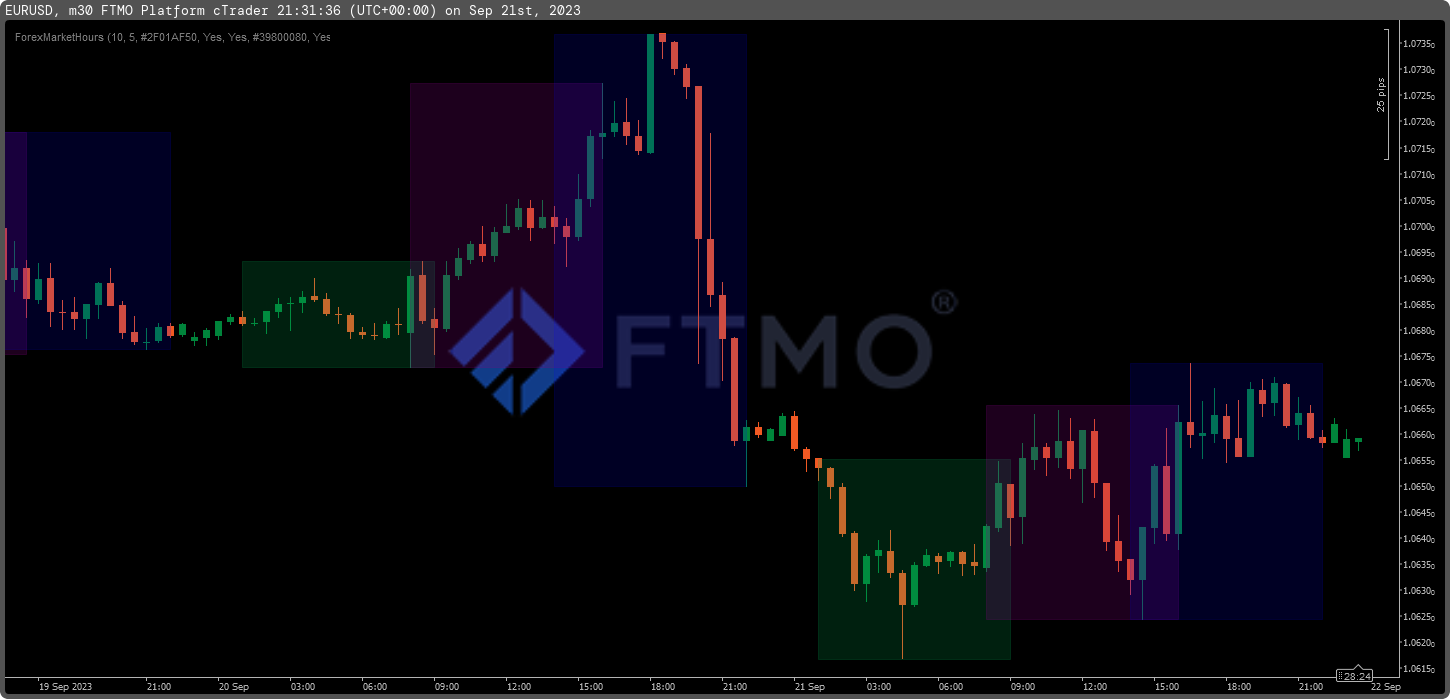
This indicator displays market hours directly on the chart according to the part of the world where stock exchanges are currently open (Frankfurt, London, New York and Tokyo). The indicator also shows directly in the chart in which range the price moved during opening hours. It uses the Time Zone Converter to update the opening hours, so you don't have to update it yourself.
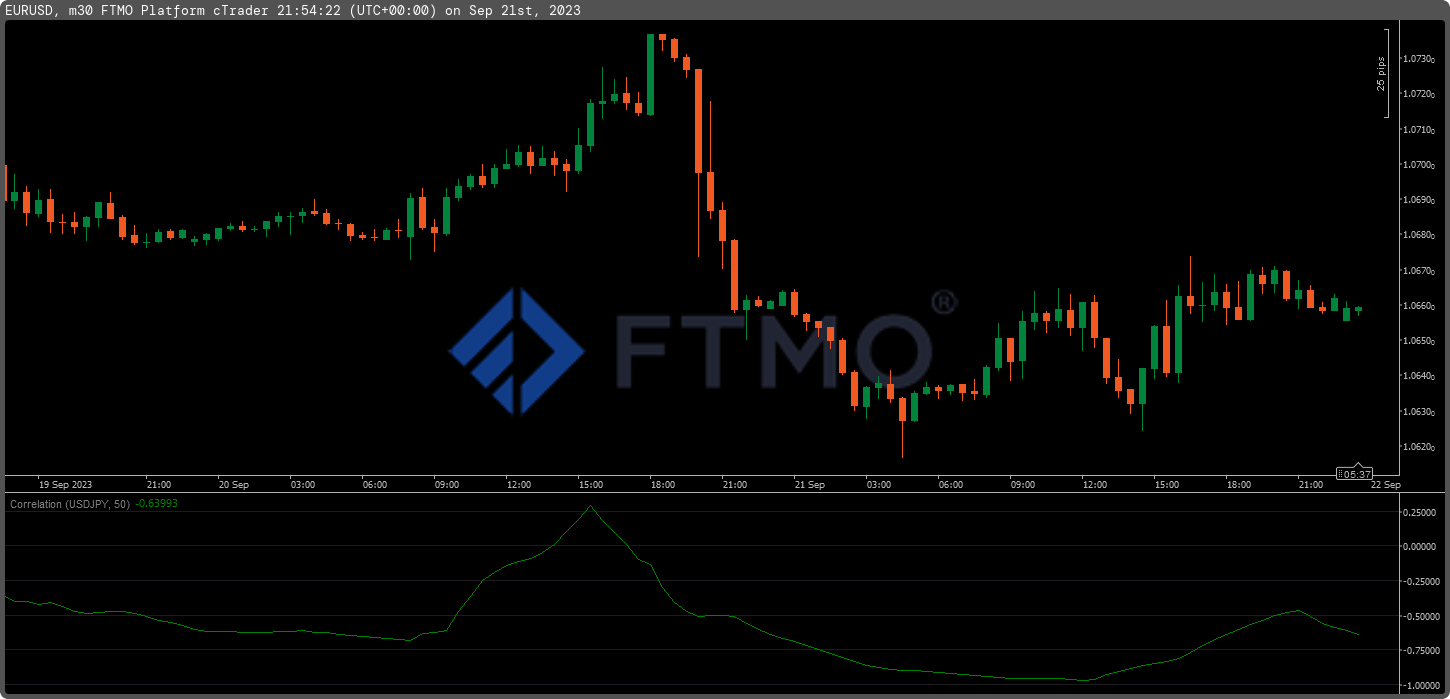
Currency Correlation
The correlation between currency pairs is especially important for those traders who open positions on multiple currency pairs at the same time. For example, if a trader simultaneously opens a short position on the EURUSD pair and a long position on the USDJPY pair, it is usually an unnecessarily large exposure in the US dollar, since in both cases the trader is speculating on its appreciation and these currency pairs are usually very highly correlated.
This simple indicator shows you the current and historical correlation between selected pairs, so you are better informed about whether or not you should diversify your risk when deciding on your positions.
ZigZag
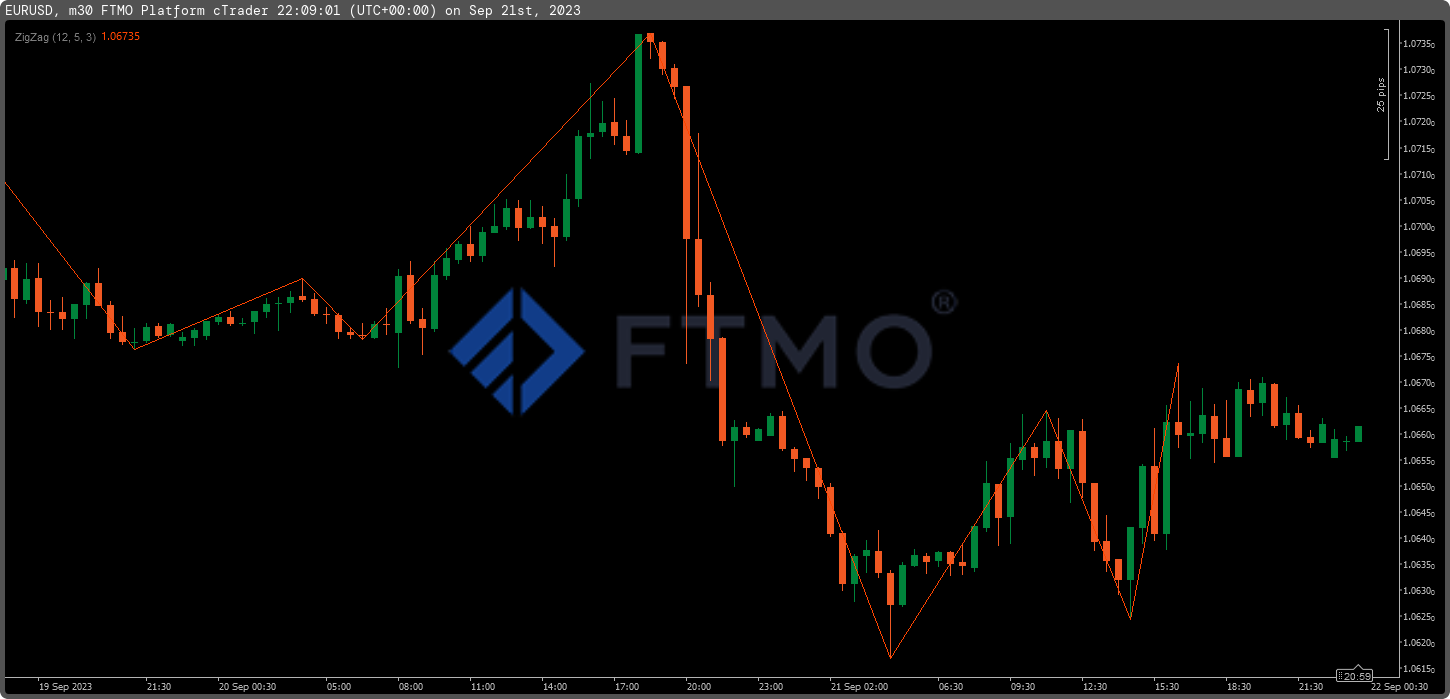
The Zig Zag is quite a popular indicator among Forex traders. It is mainly used as a supplement to mark or confirm a trend, or as an indicator of a possible trend reversal. It is not recommended to be used alone like other indicators, but as a supplementary tool, this indicator can work very well.
Supply and Demand Zones
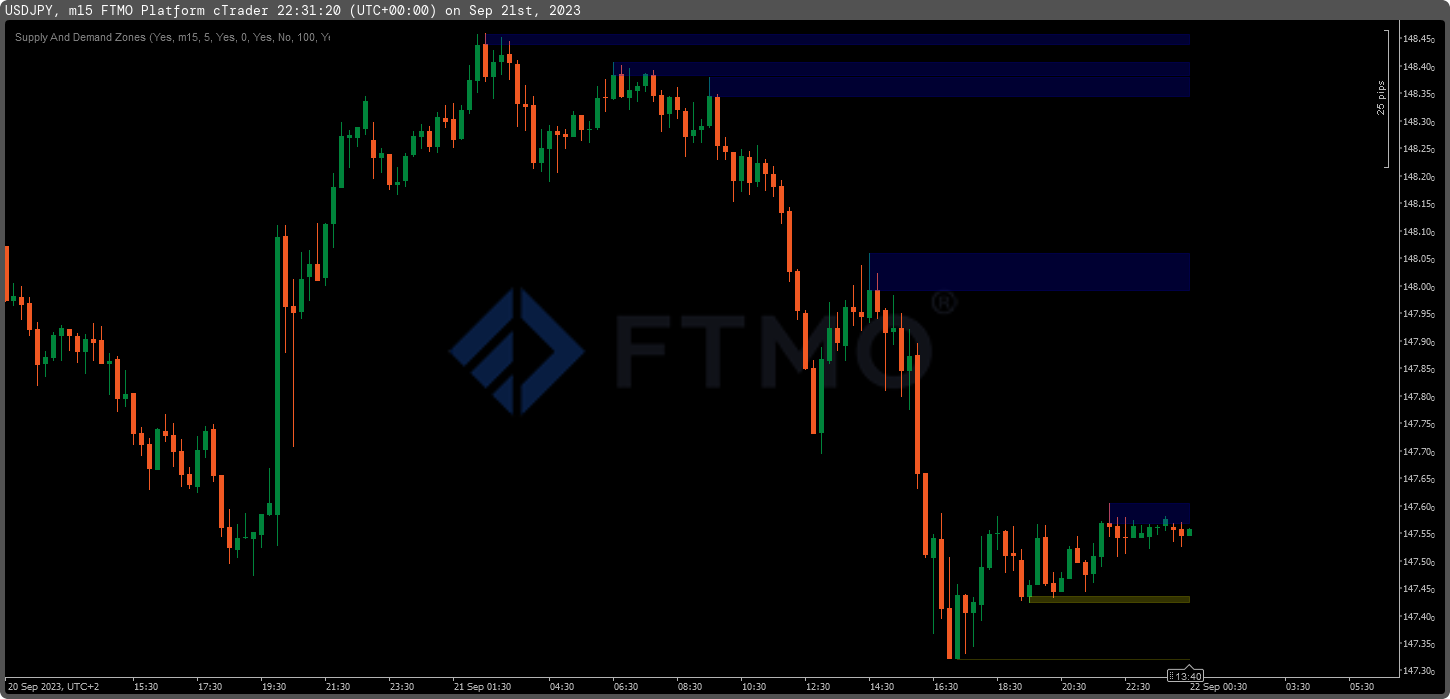
As with MetaTrader, cTrader traders will appreciate an indicator that plots demand and supply levels. These often coincide with support and resistance levels, which we can use to identify them.
Again, the indicator works for all timeframes and can be used with a variety of settings.
Draw Spread
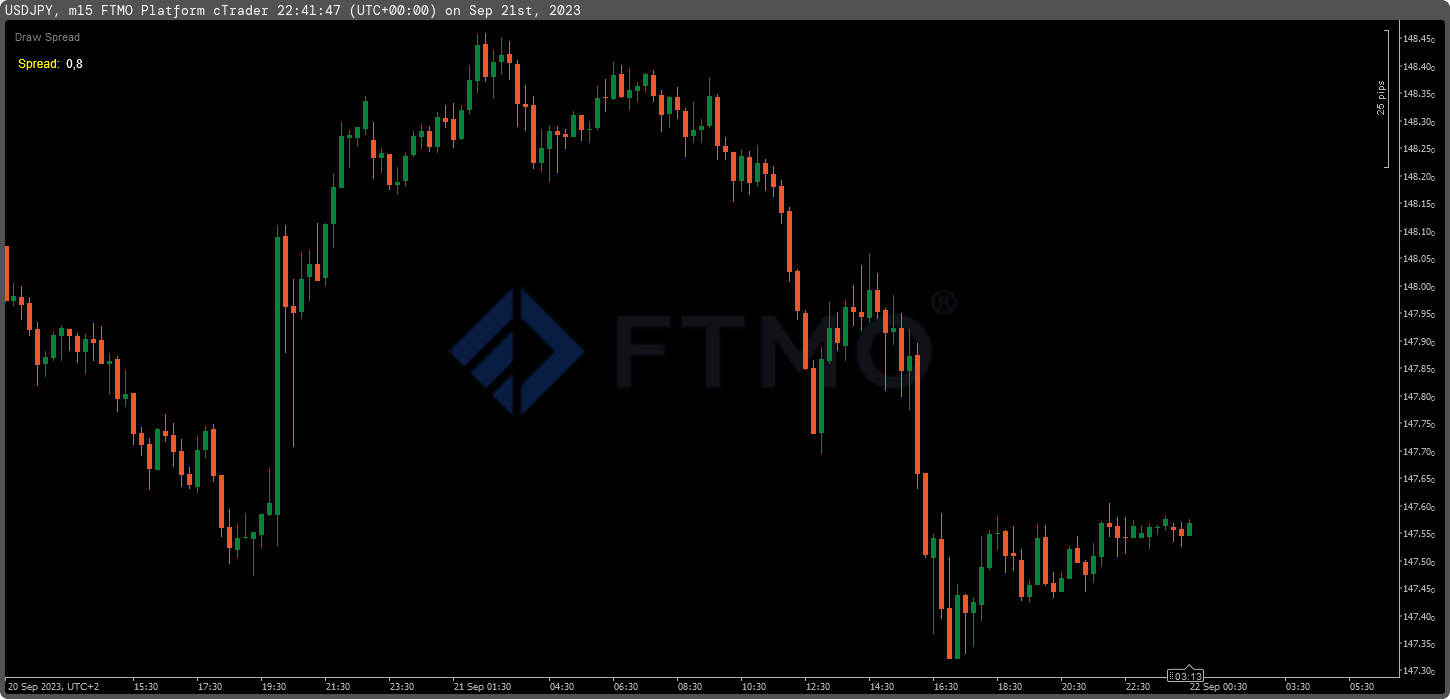
Finally, a very simple addition that many traders like to use. It is used to mark the size of the current spread directly in the chart window. While we can check the spread in the adjacent symbol window, many of us simply want to have an overview by looking at the chart itself without looking for small numbers somewhere outside the price chart.
This article is for informational purposes only, and some information may not reflect the current service offering or product features. Please always verify the latest terms on the official product pages.
About FTMO
FTMO has developed a two-step evaluation process to find trading talents. Upon successful completion, you may be eligible for an FTMO Rewards Account with a balance of up to $200,000 in simulated funds. How does it work?


