


Renko Chart – A new perspective to inform a trader

Is the time factor important in trading? Shouldn’t we rather focus on the price itself? Do large traders even care about what time it is and when the next candlestick closes, or do they just watch price levels instead? Even a small change can have a large impact on trading results and your trading plan.

Renko Chart – A new perspective to inform a trader
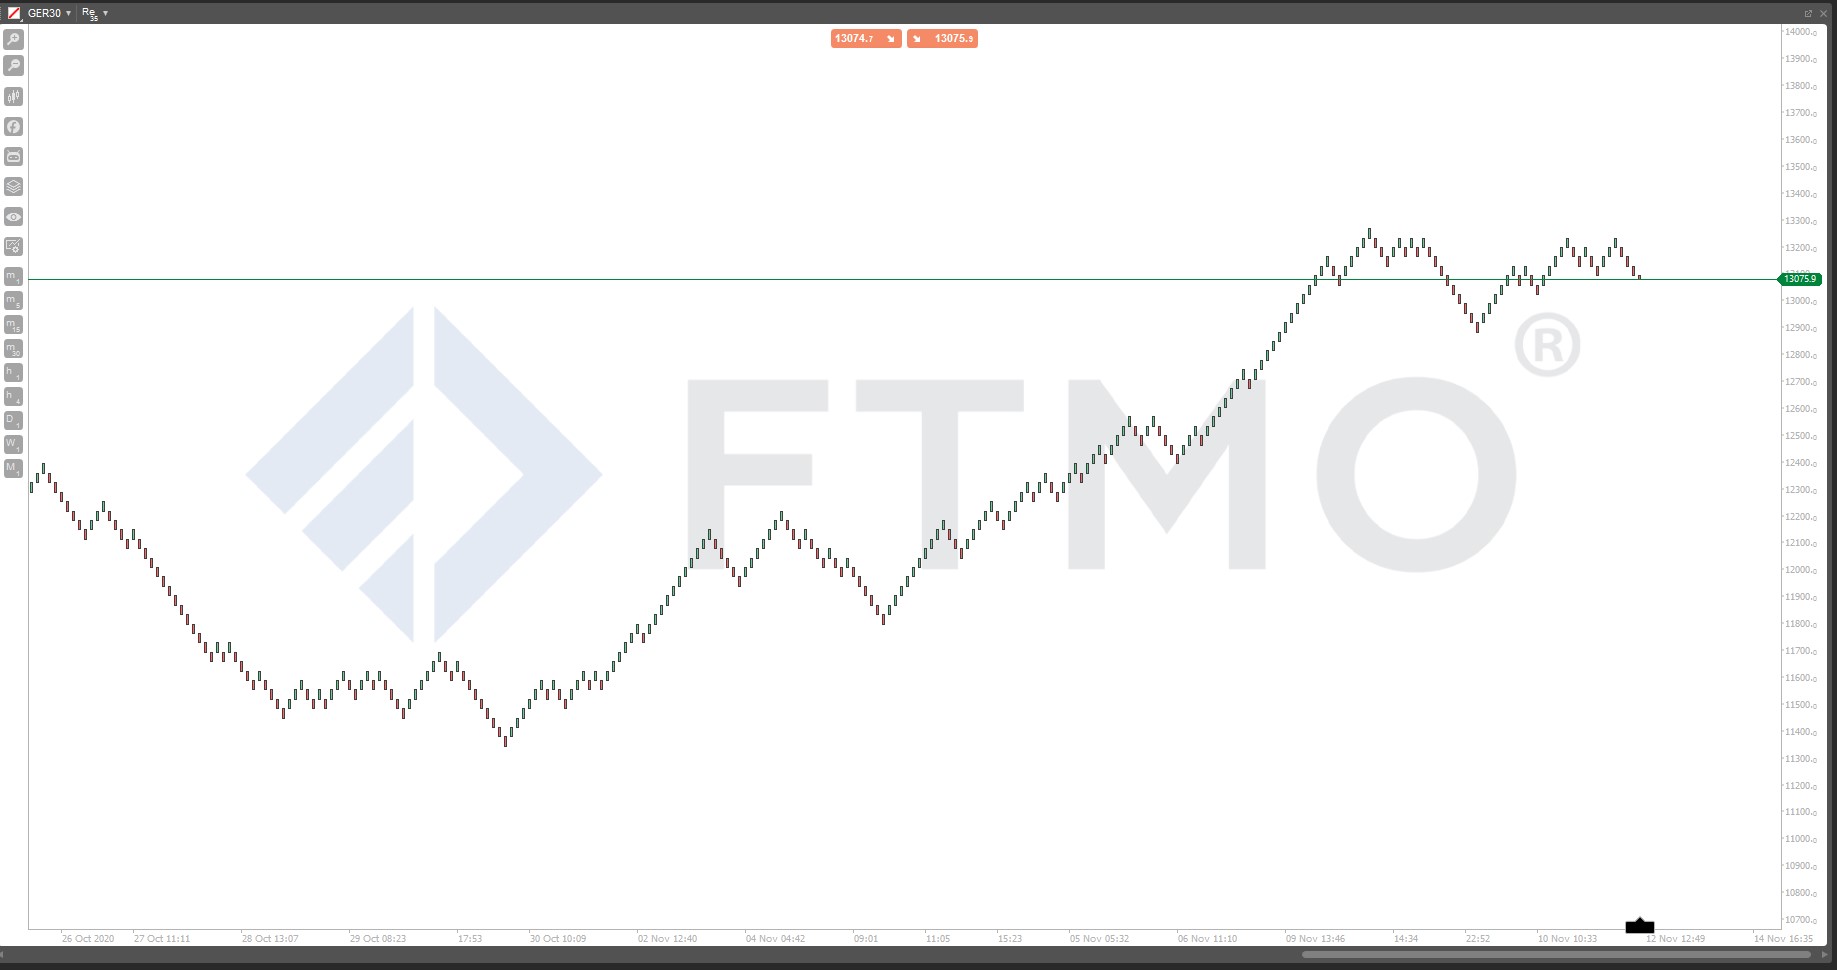
Most of us are familiar with the traditional charts in form of candlesticks. We also use various time frames to adjust the perception of the chart according to our needs.
So, we know that each candlestick signals a specific time span that we can analyze and determine what value it will take. It is up to us if we are looking at candles on a minute frame or candle on a 1-hour frame.
Now, the real question is – do we really need to consider the time as relevant information? Do buyers and sellers care about some time span data? Every trader might perceive this differently, and the time factor often has a slightly different meaning to traders who trade from remote.
We meet traders from all over the world, so the question is: Is the time factor really that important and is it necessary information to consider in the markets?
After all, the market is primarily concerned with price.
What about trying to change the view from a time factor to the perspective of price, as that is where traders focus most.
Such a perspective will bring us closer to a Renko chart, where one candle is not related to specific time data, but it looks more into the price fluctuations.
So, the candle looks a little different from what we are used to because all the candles are the same in size. We call them the bricks, which is a Japanese origin word “renga”.
Advantage of Renko chart
- Elimination of time
- Better movement tracking of the market
- In the period of low volatility, we don’t take signals
- Unified size
Many traders struggle with trading failures because they lack discipline.
We can often meet with constant undesired recurrence like frequently changing or postponing the stop loss or take profit.
Usually, this is caused by impatience, when the trade is going in our direction, and then the direction changes in the opposite direction, and we do act reactively.
Thanks to that we are decreasing our possible long-term profits which mostly do not cover our losses.
Reactions based on our emotions are not used in the professional trader community.
Using the Renko chart, which looks at the market only when it really moves, we can improve our trading and that could help us with desired results.
Let’s say we define that one brick signifies a movement of 5 pips.
So, until the market moves these 5 pips in one direction (from the close of the last brick), no more bricks will be drawn.
It can take hours or just a few seconds. The price always plays a role, not the time. In most cases, the time pressure causes psychological squeeze for traders, which is a very difficult aspect to handle.

How to add a Renko chart to an MT4 platform?
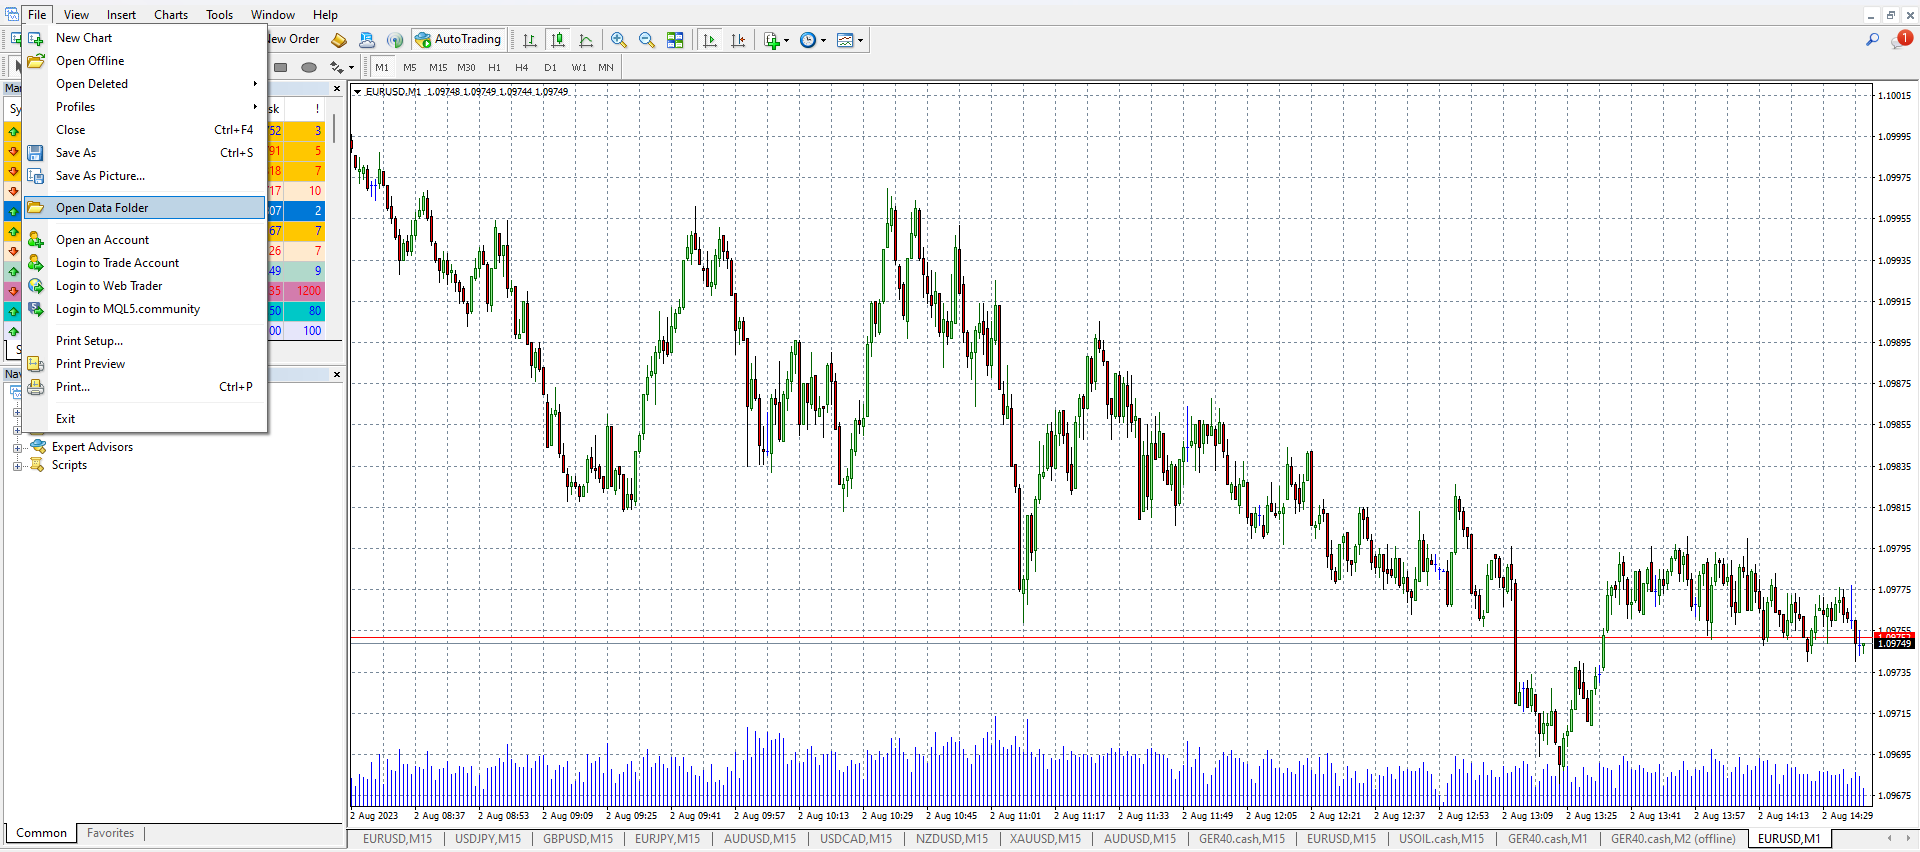
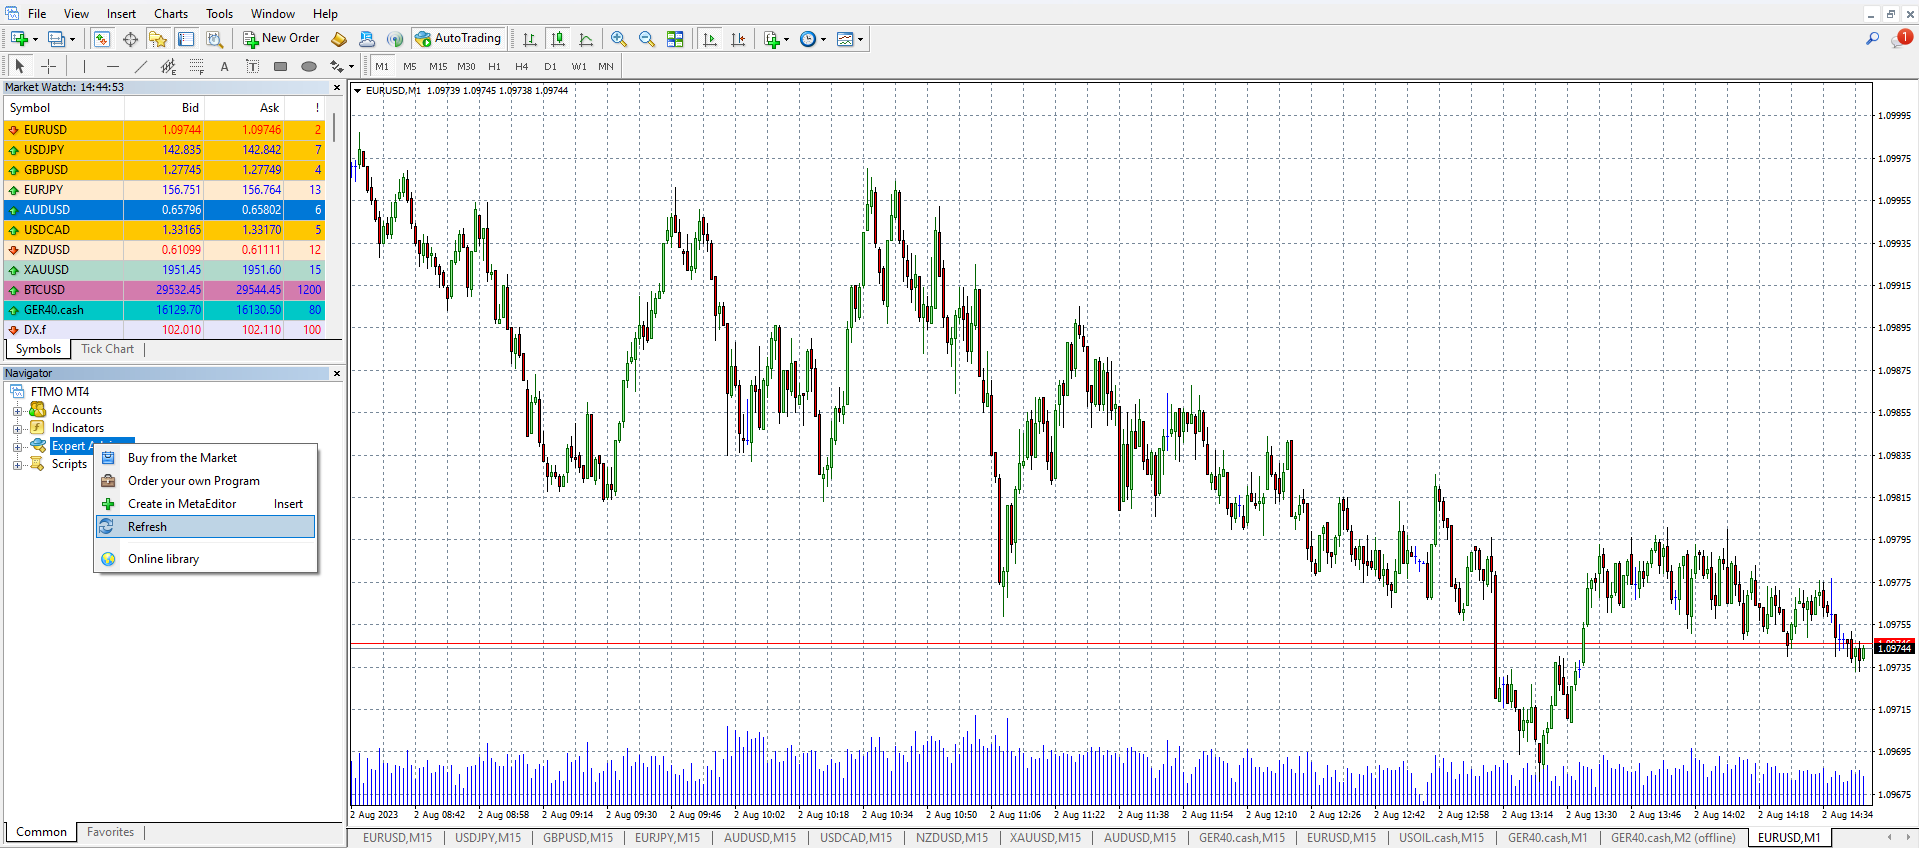
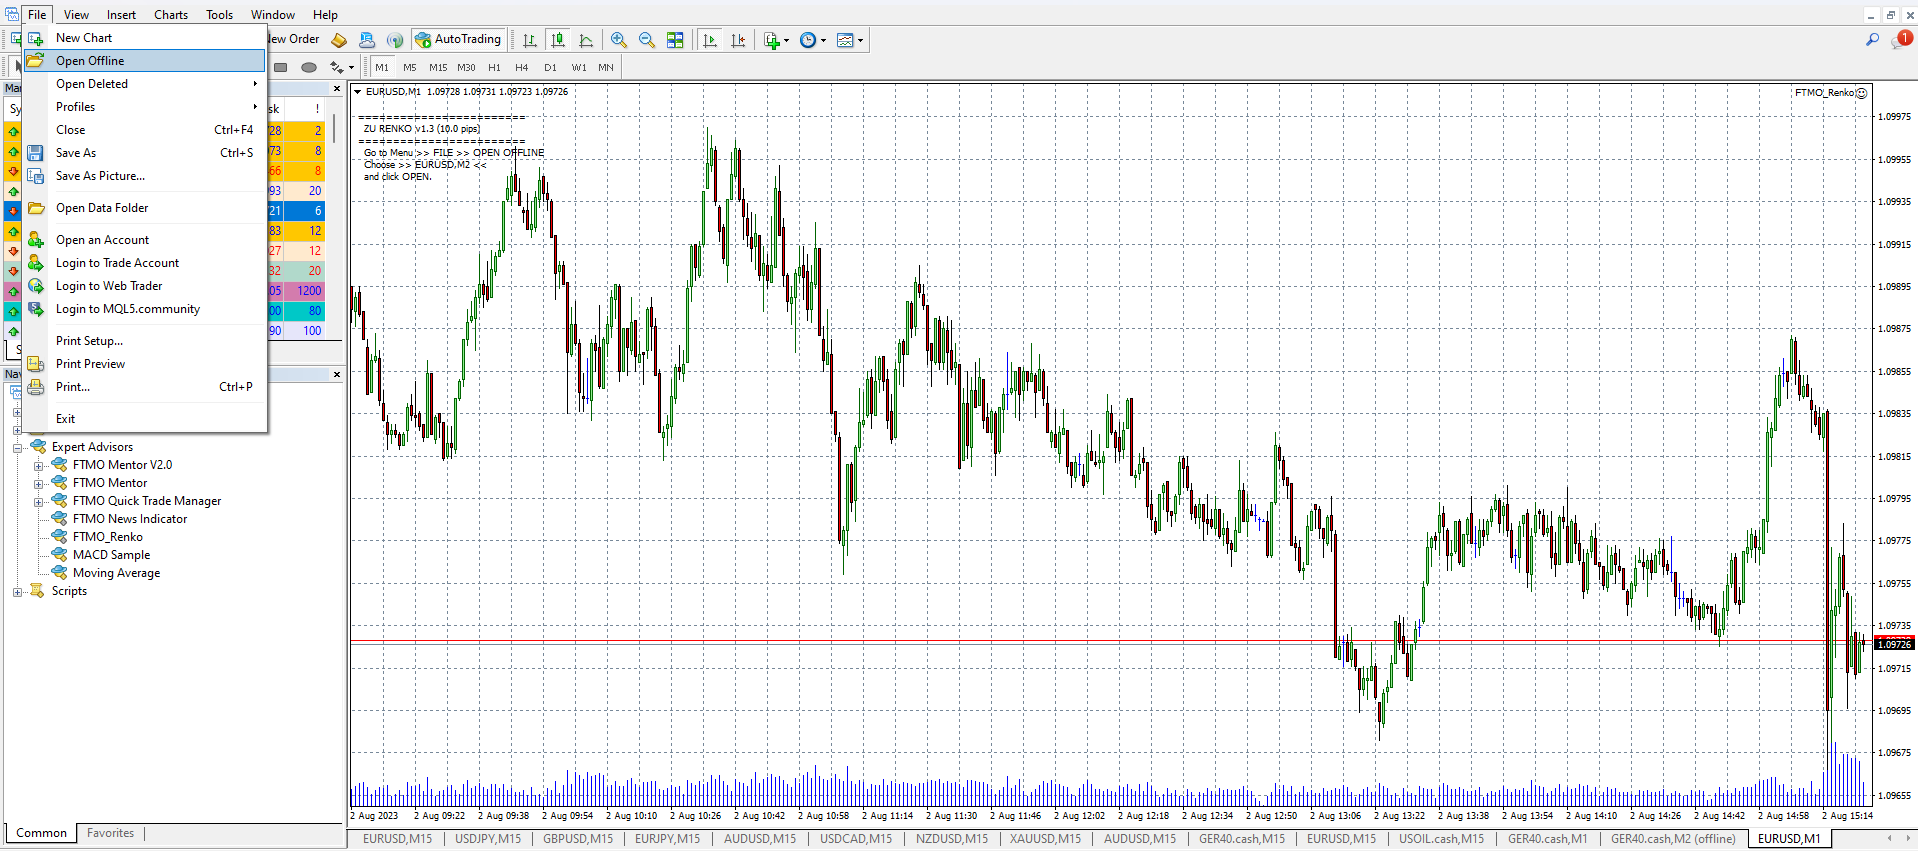
Renko charts are a standard technical tool in the cTrader application, but it is not available in the MetaTrader4 trading platform. However, its implementation is not complicated at all. To set up a Renko chart, we first need to download a custom indicator. This indicator is available directly below this article. Renko chart is an entire strategy that will enable placing bricks on a chart of the MetaTrader4 platform, which is most commonly used by Forex traders. We will get this strategy into the platform in the same way as other automated trading strategies. First of all, we need to copy and paste the downloaded FTMO_Renko file into the MetaTrader4 folder, which will allow us to use Renko Charts. So, we first need to open the MT4 platform, then we need to go to “File” and “Open Data Folder”.
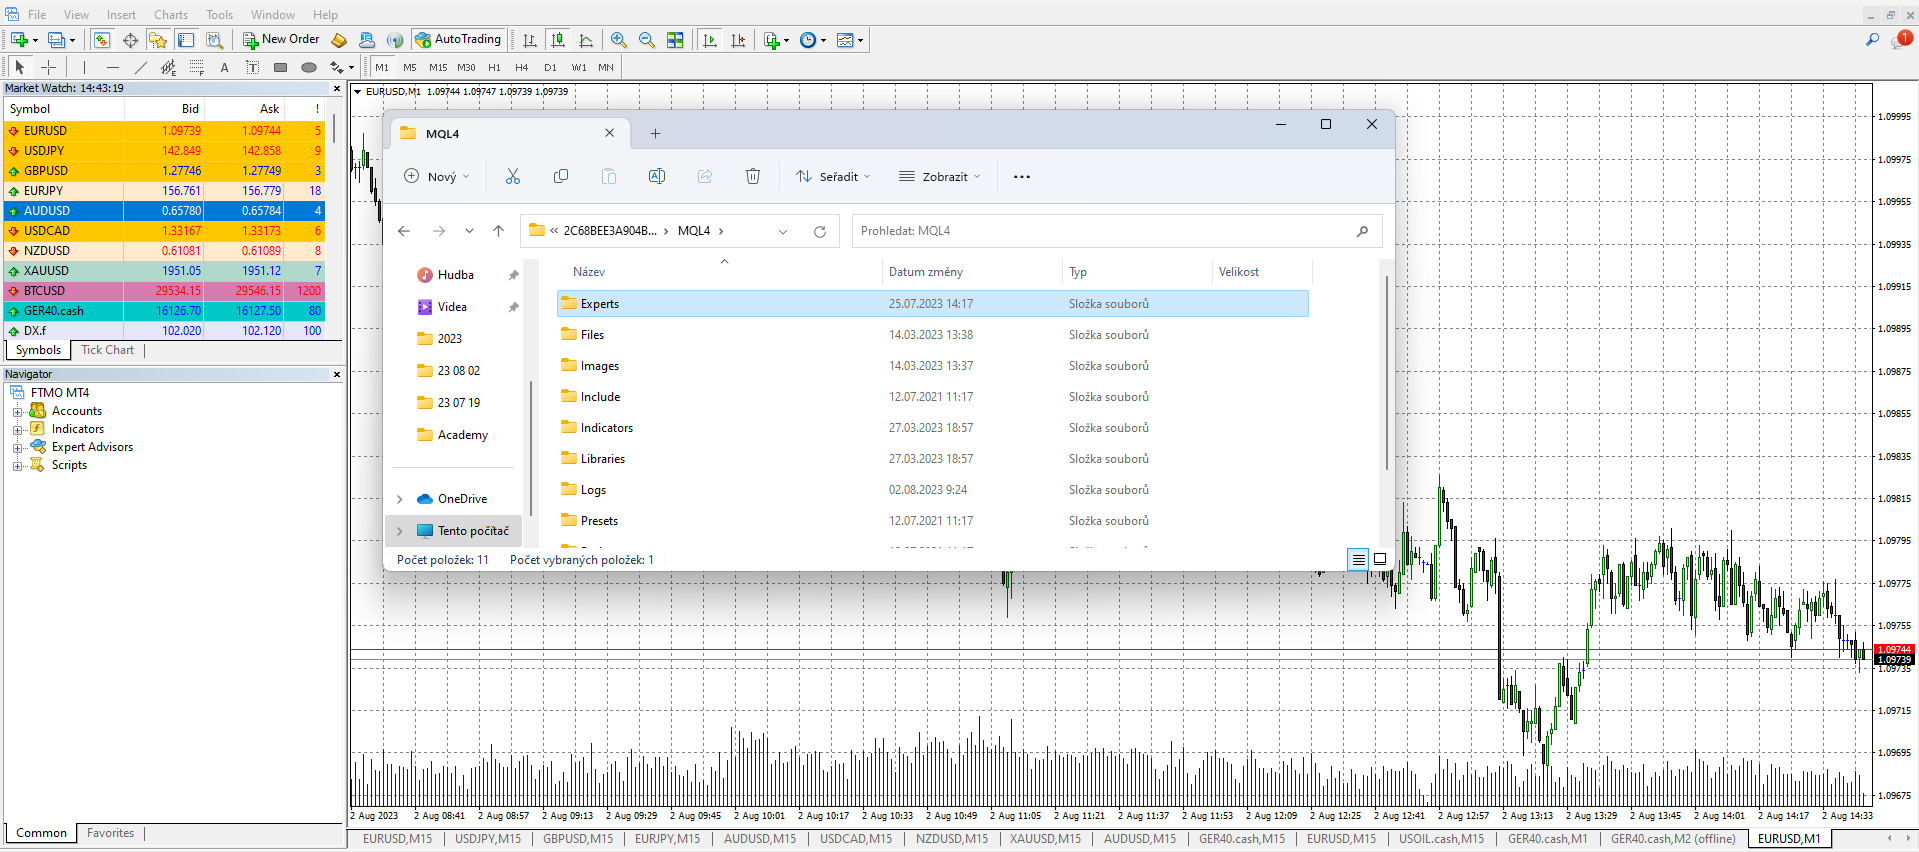
We need to locate the MQL4 folder which contains the Experts folder.
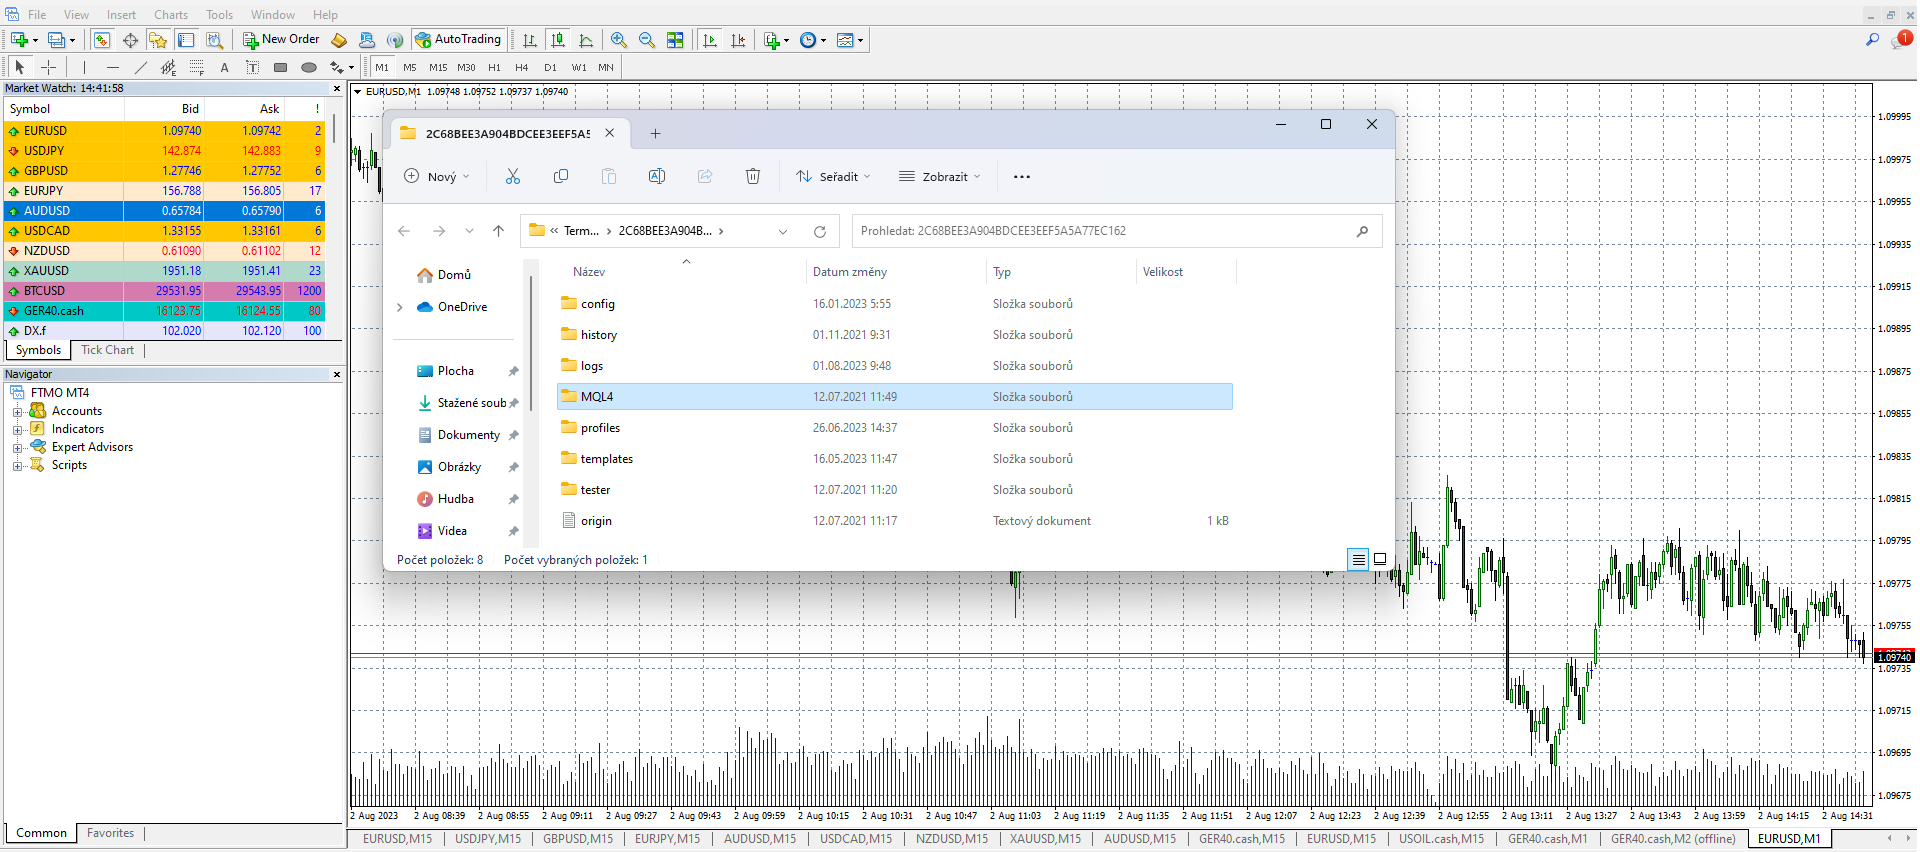
You will then need to copy and paste the downloaded FTMO_Renko file right into the Experts folder.
After that, you will need to update your MetaTrader4. Alternatively, we can simply click on “Strategies”, which can be found in the right menu, with the right mouse button to update it.
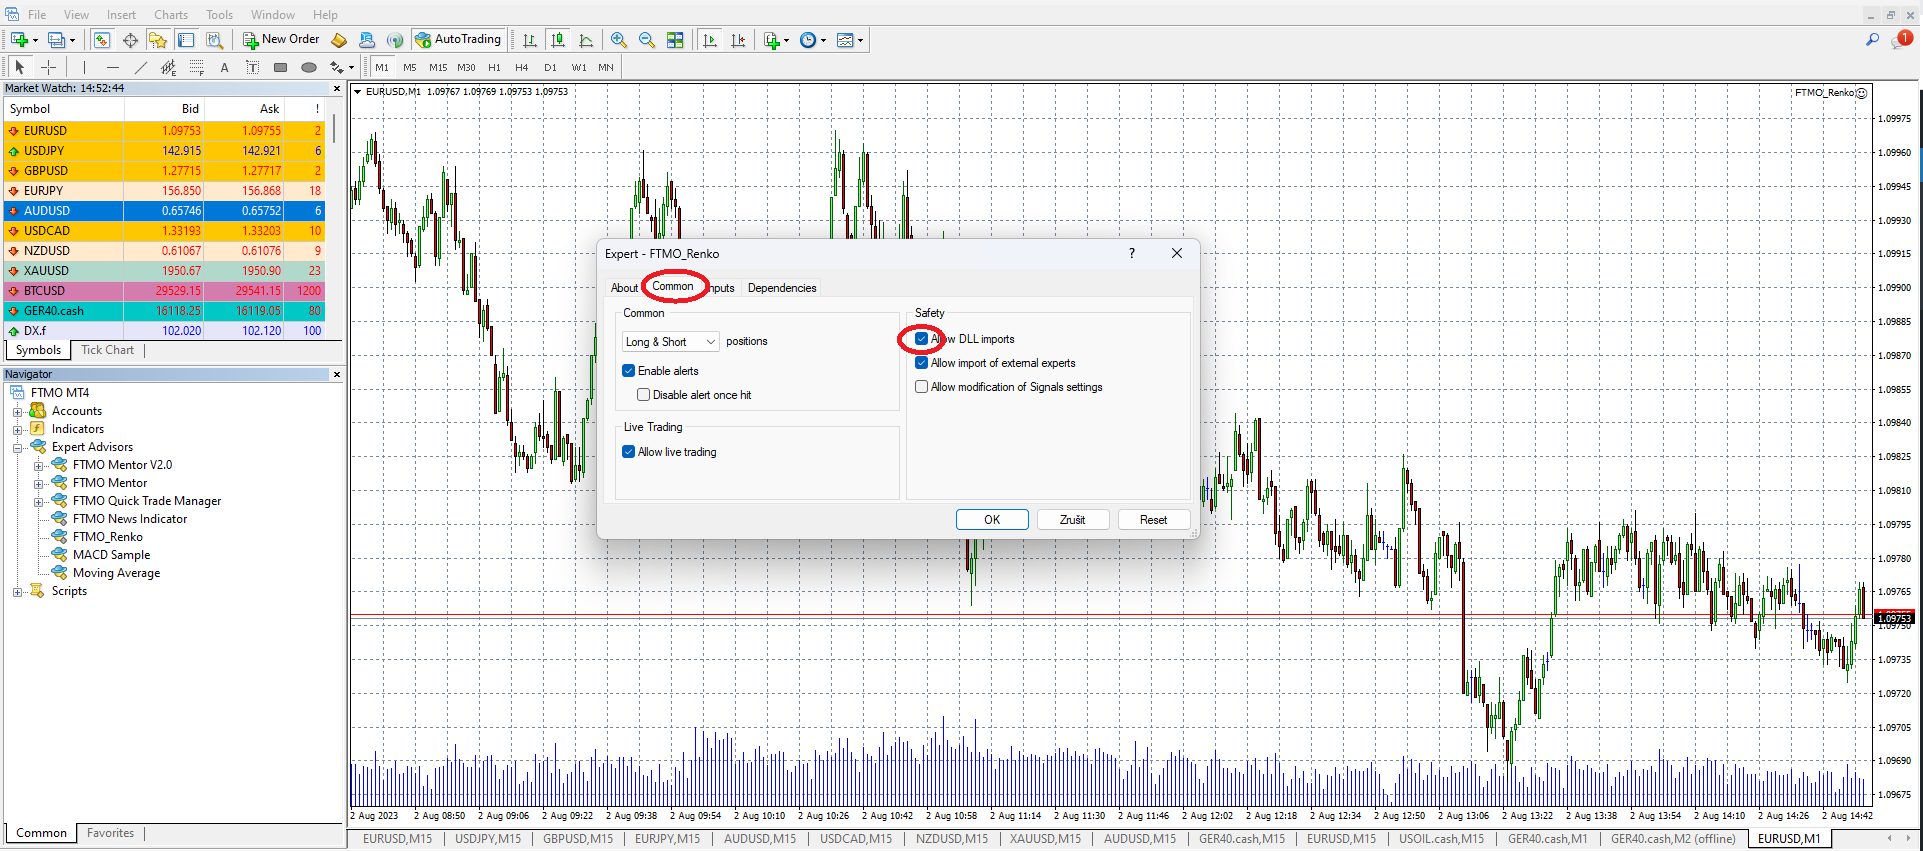
All that is left to do now is to start and set up the Renko chart. Drag and drop FTMO_Renko into the chart or double-click it with the left mouse button to launch the strategy. It is very important to enable the DLL import strategy as without enabling it the strategy will not work properly. In order to draw bricks correctly, you need to set the chart to the M1 time frame.
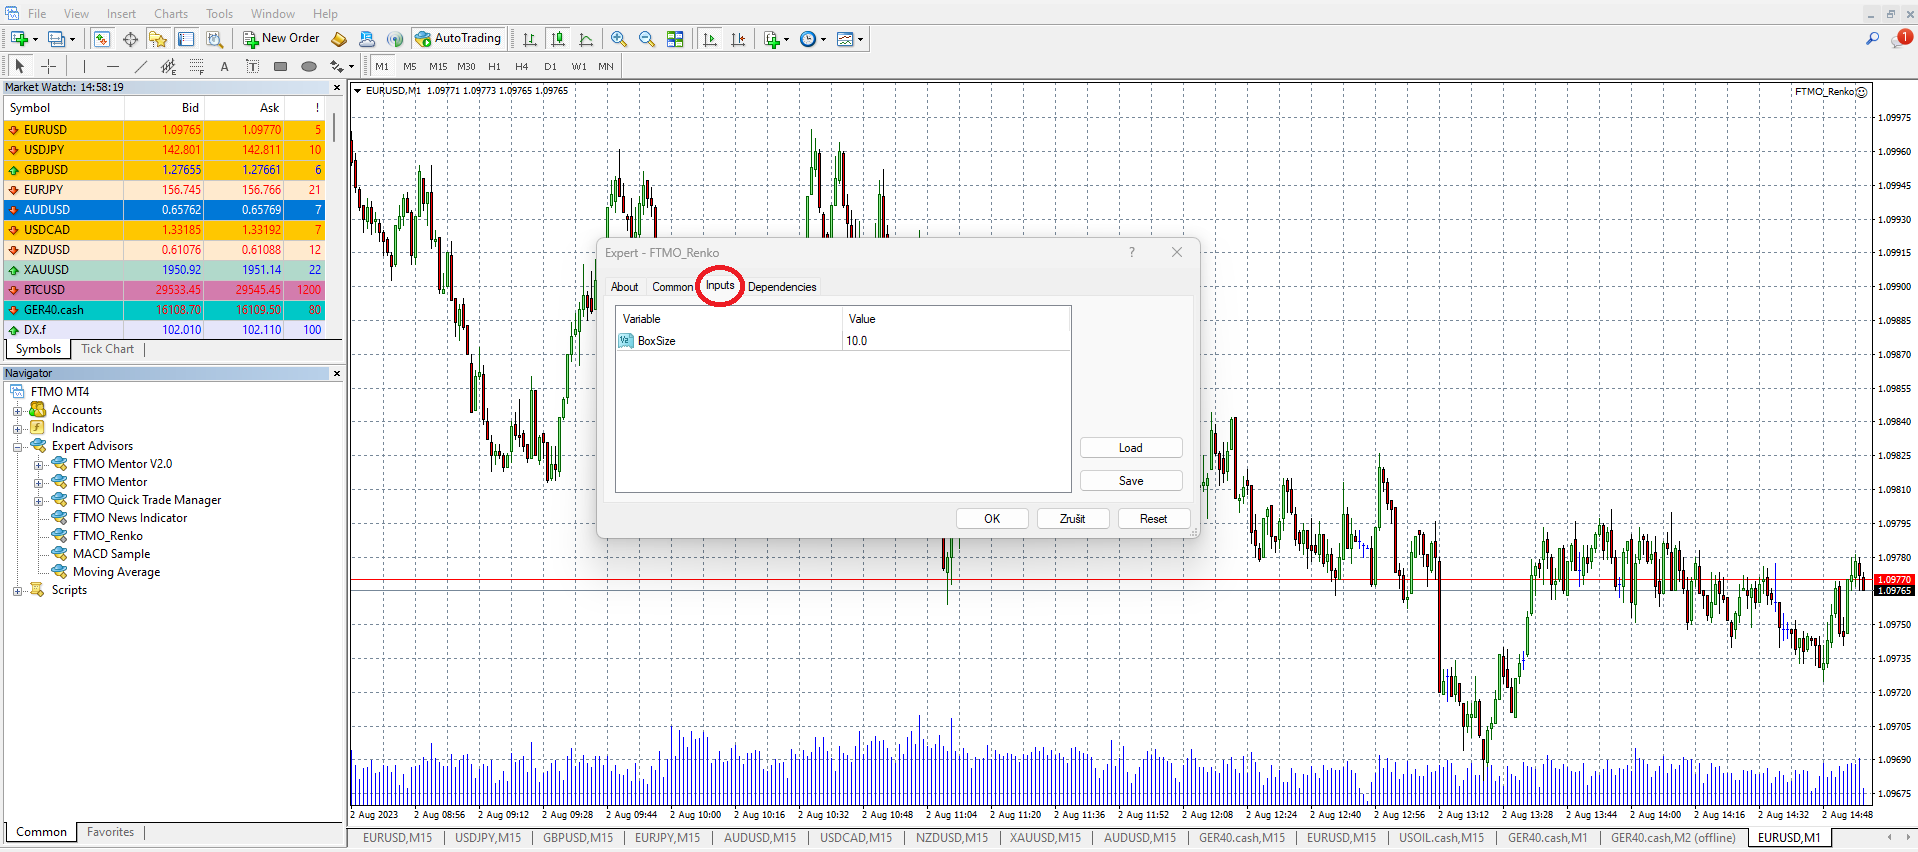
Next, you will find a table with parameter settings on the screen. Here we have to set only one parameter. This parameter determines the size of one brick on the Renko chart. The size of the brick indicates how big the movement in one direction has to be before this one brick is drawn on the graph. For example, if you enter 10 on the EURUSD chart, each pip will represent a movement of 10.0 pips in either direction. If you enter 400 on the GER40.cash index chart, one pip will represent a movement of 4.00 points.
After confirming the changes with the “OK” button, we need to get back to the chart, where we can find a small tutorial on how to start the Renko chart in the upper left corner We will be opening an offline chart, however, there is no need to worry as the data is still available online.
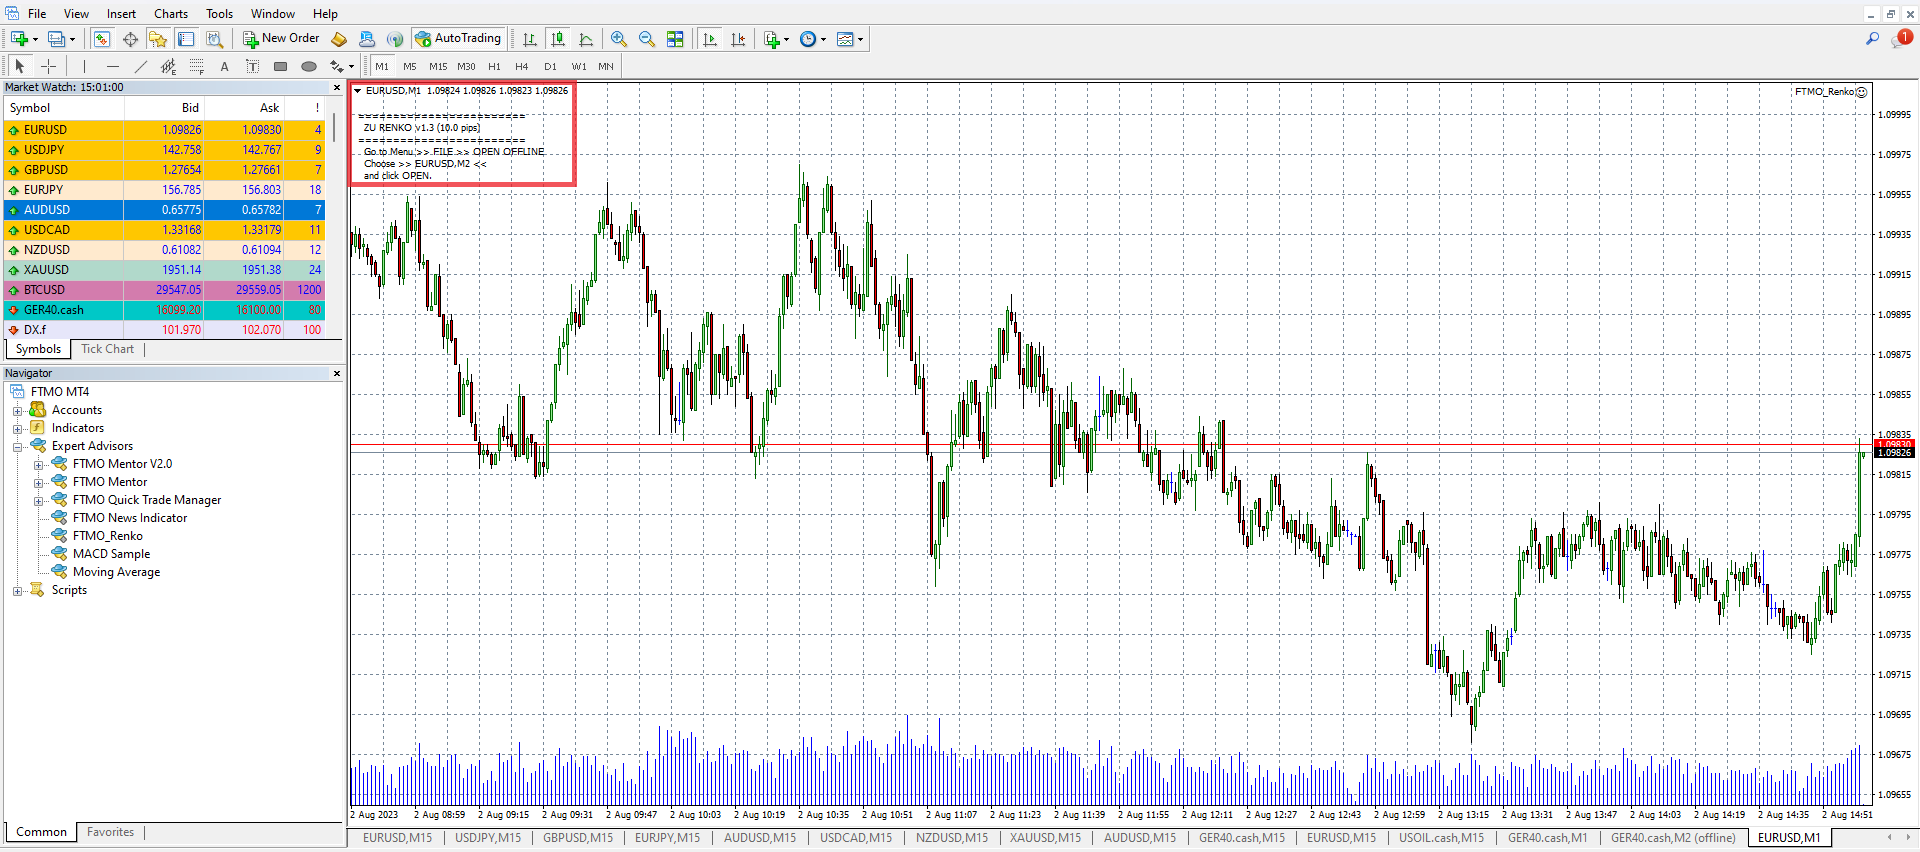
Again, please click on the “File” button and select “Open Offline”.
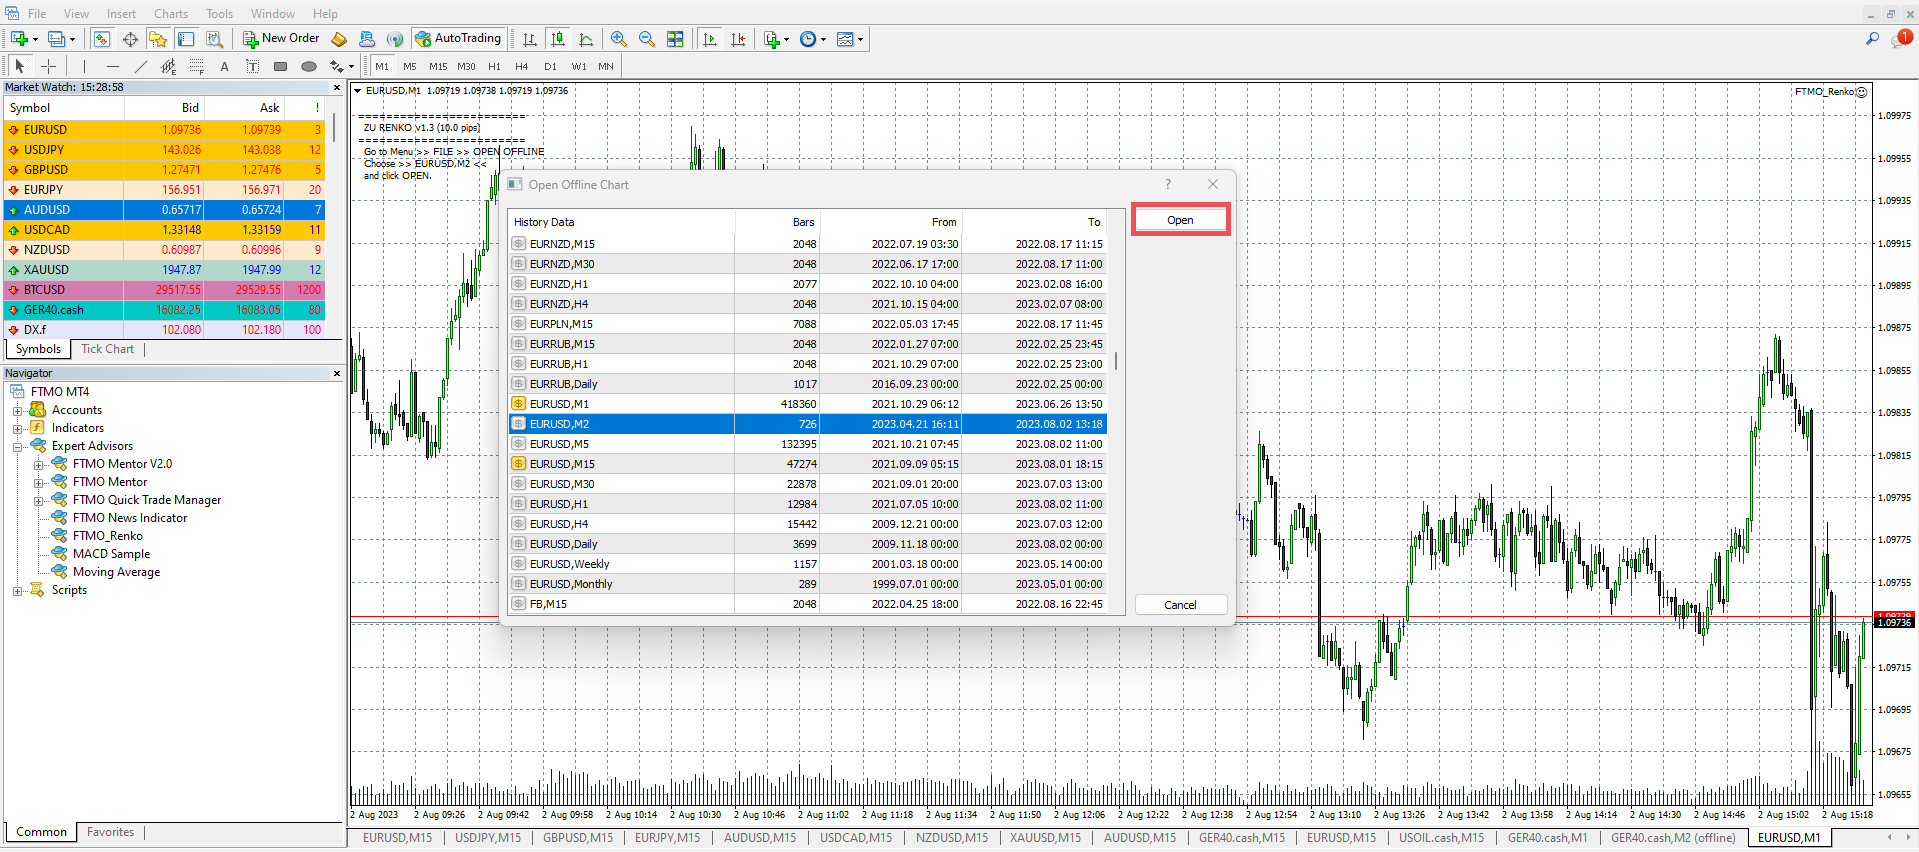
Now we will need to select the name of the instrument to which the FTMO_Renko strategy has been assigned. If you have not changed any other settings, we are looking for a chart with a time period of M2. It is a good idea to check what exactly to look for in the top left corner of the chart, where a brief guide is displayed. The last step is to click the Open button after selecting the correct chart.
You will find the Renko chart open in a new window. In this case, the chart is for EURUSD, where each brick is worth 10 pips. It is important not to turn off the original chart (the one where this strategy is running), but only minimize it, for example. Please note that if you close the chart, the Renko chart will stop updating.
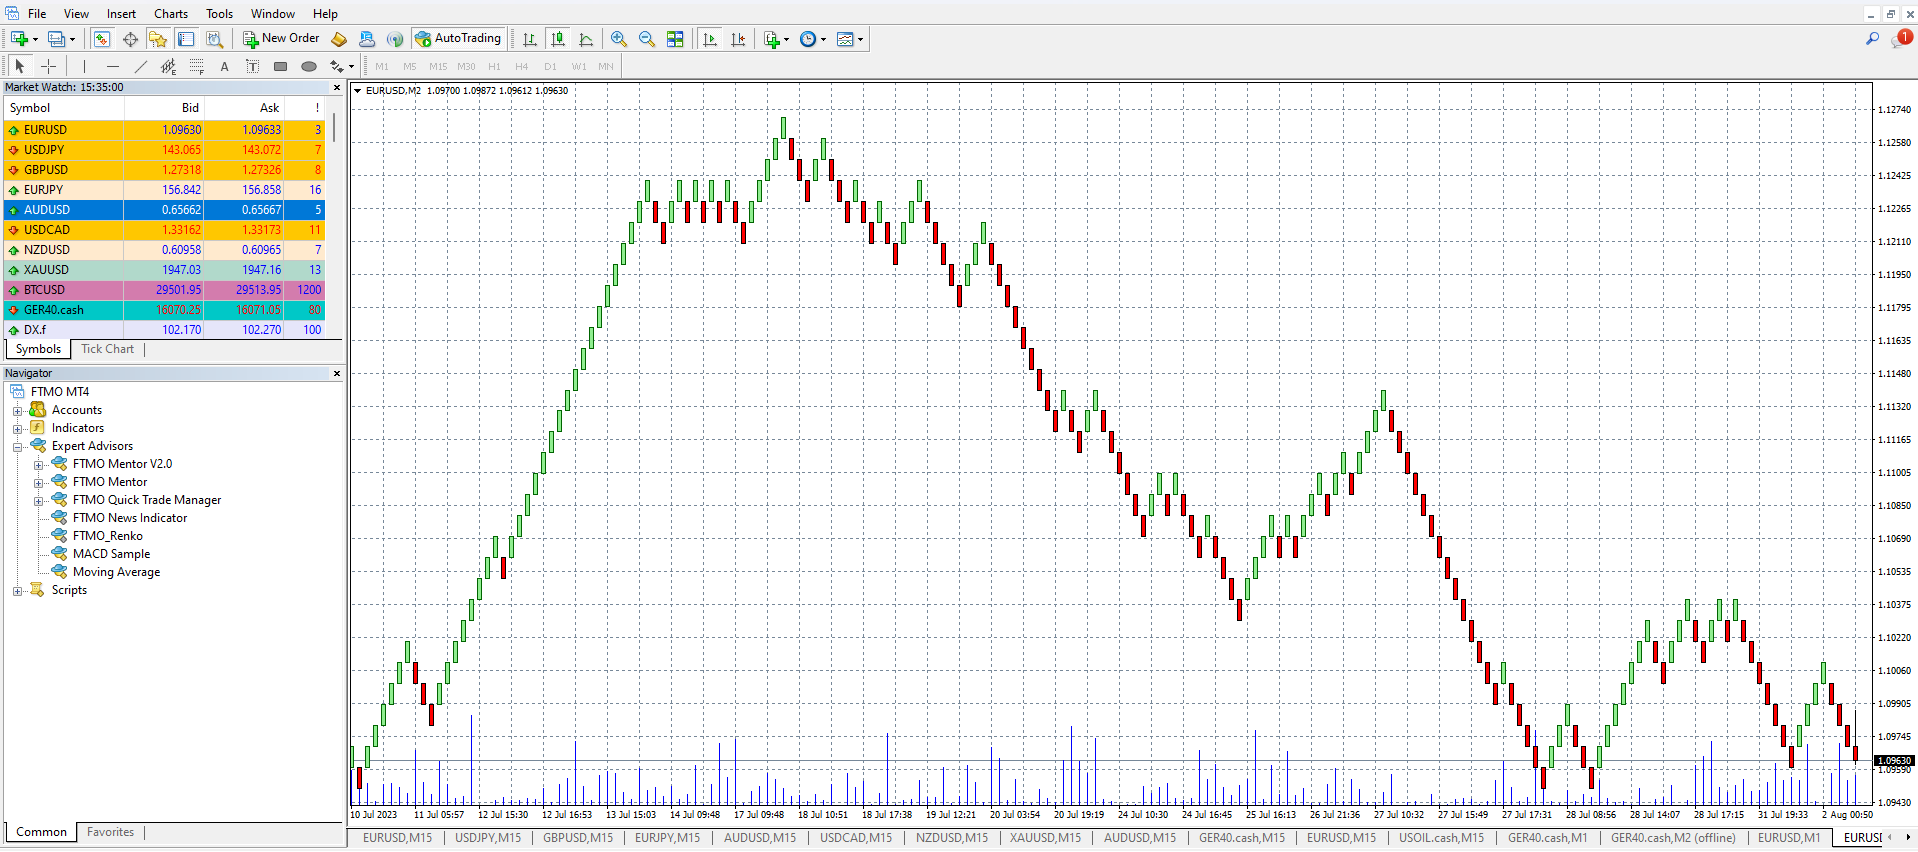
We have now successfully installed and launched a Renko chart in the MetaTrader4 trading platform. The current view of the chart is slightly different than usual. For some traders, it can certainly be an interesting experience, to say the least, with a different view of the market, and for others, it may mean finding a particular style that suits them much better than the classic chart functionality that most traders struggle with from their first exposure to trading. You can download the indicator here.


- As many Free Trials as you need
- Up to $200,000 account
- No time limit

Worldwide Reviews