


Order Flow: How to Predict Market Reversals

In the first part of our Order Flow series, we explained basic market mechanics and discovered why candlesticks alone often fail to show the whole picture. We now know that aggressive (market) orders move the price, while passive (limit) orders slow it down. We also demonstrated how to identify imbalance and absorption on a Footprint chart.
Today, we are going even deeper. We will show you exactly how a trend reversal occurs, who gets the short end of the stick in the market, and what specific patterns you should be looking for at the key highs and lows of the day.
3 Ways the Market Changes Direction
Imagine the market is rising sharply. Price always moves along the “path of least resistance” and seeks out liquidity (the meat) from limit orders. Buyers are in a strong imbalance (they have the upper hand), and the price is flying upwards towards a strong resistance where this substantial liquidity awaits. For this uptrend to reverse into a short, one of three scenarios must occur:
- Absorption (hitting a brick wall): Aggressive buyers continue to buy, the cumulative delta rises, but the price stops moving higher. They are being absorbed by massive limit orders from sellers. This appears as a huge green ask on the high that failed to push the price further.
- Exhaustion (running out of steam): Buyers have simply stopped buying. The price might “tap” the level a few more times, but volume drops dramatically. On the Footprint chart, we can see that there is no activity at the very top (e.g., 0 bids/a low number of asks).
- Aggressive counter-attack: Aggressive sellers (market sell) suddenly enter the market, sweeping away the buyers with their massive volume and seizing control.
The foundation of successful order flow trading is hunting for precisely these moments at key price levels.
Hidden Market Players and High/Low Traps
When the price reaches a crucial S/R zone, the Footprint chart can show us exactly how individual players behaved. These are the most common patterns confirming that a reversal is imminent:
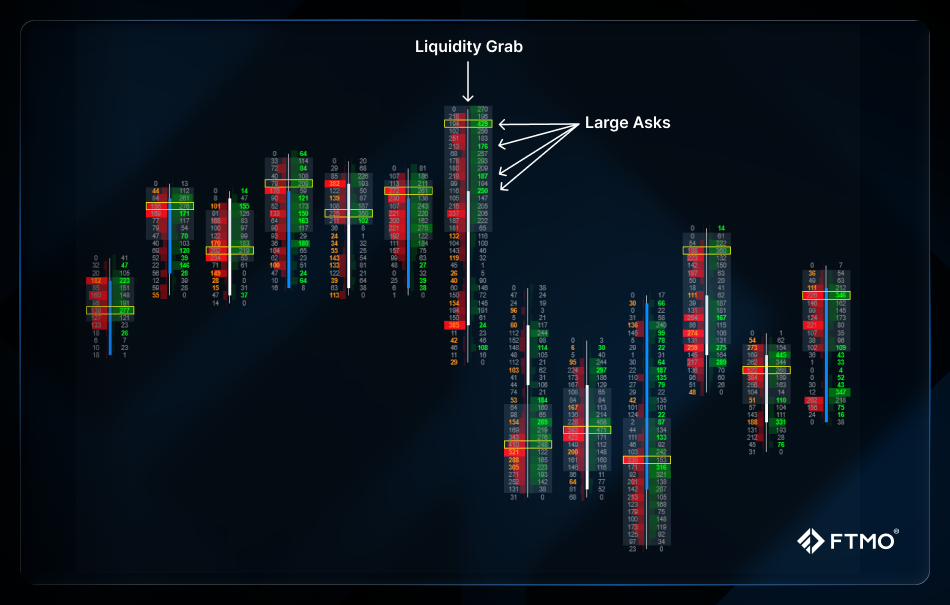
Large Asks on the High / Large Bids on the Low
If the market reaches a high and executes massive buying volumes (asks), it should immediately shoot higher and continue the trend. However, if these huge purchases fail to sustain the price (and the price closes below them), it is a trap.
These aggressive buyers were absorbed by limit sellers (MKT buy hit LMT sell), and the market is preparing for a hard fall. These buyers are now trapped in a loss, and their stop losses (which act as market sell orders) will help the market fall.

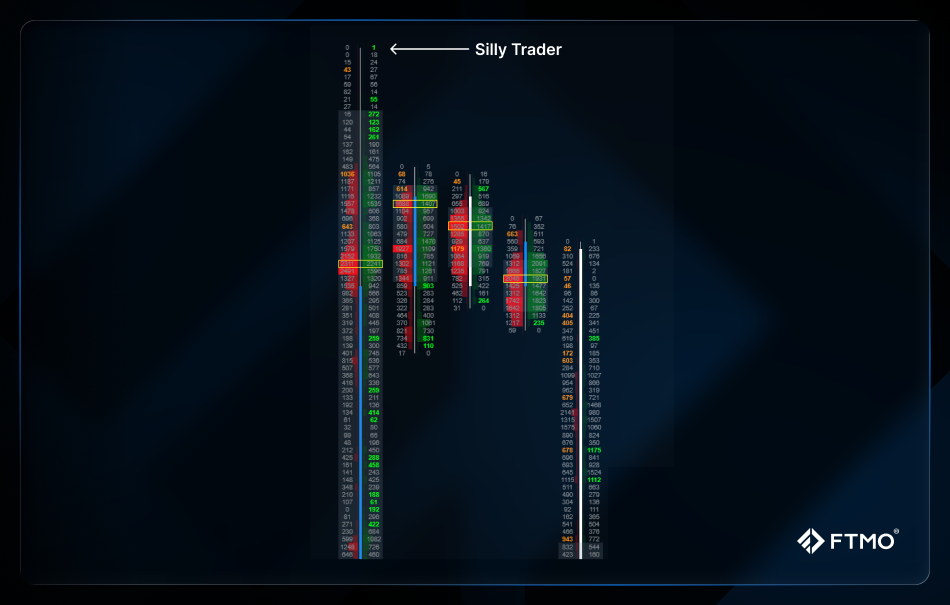
The “Silly Trader” Trap
You surely know the feeling: the market is flying up, FOMO (Fear of Missing Out) kicks in, and you buy at the absolute peak, only for the price to instantly reverse against you. On a Footprint chart, we can pinpoint these people exactly. These are formations at the extreme highs or lows of candlesticks, for example:
- 0 bids / 1 ask on the high (or 1 / 0): This means there was exactly 1 last person who bought at the absolute summit.
If you spot a 1 bid / 0 asks formation on a low, it reveals the last “silly” seller who opened a short at the very bottom. These extremes serve as an excellent confirmation that the pressure of the original trend has been exhausted.
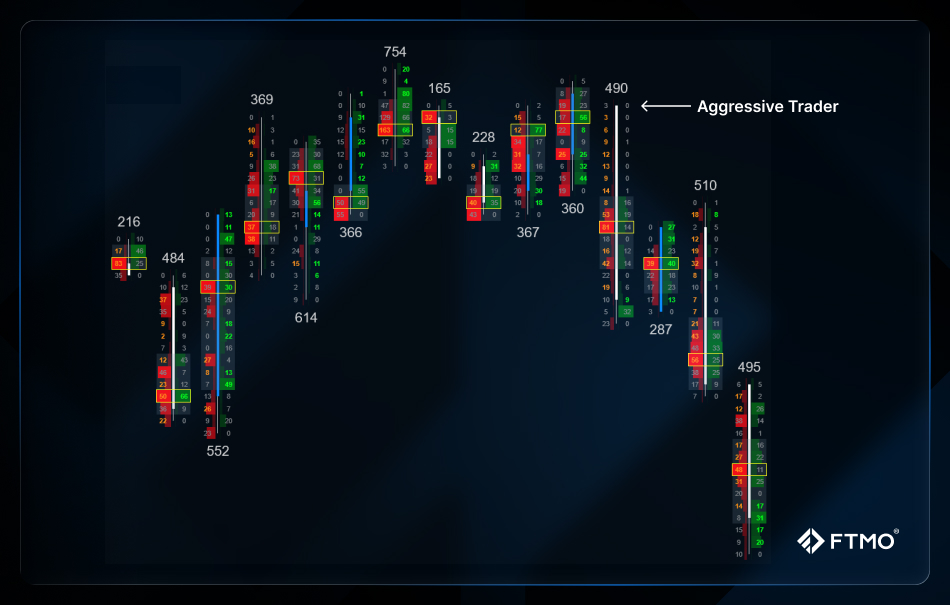
Aggressive Traders
This is the exact opposite of the silly trader scenario. Imagine a candlestick that creates a high, but at its absolute peak, you see something like 1 bid / 0 asks. What does this mean? It means someone aggressively sold (market sell) on the exact tick where the high was, and no buyer (ask = 0) managed to get up there. This zero buyer volume, combined with the immediate intervention of sellers, is a strong signal for a downward reversal.
What Does Price Action Look Like Under an X-Ray?
Perhaps you are already trading classic price action (pin bar, inside bar, engulfing). A footprint chart allows you to “read” these formations from the inside and determine whether they are genuinely valid or merely a visual illusion.
- The true pin bar: A perfect pin bar on a low should contain massive bids (red numbers) within its long wick (tail), which were absorbed by limit buyers. If the wick is empty and lacks volume, it is a very weak pin bar.

- False inside bar: A standard trader sees an inside candle and waits for its breakout. However, with a Footprint chart, we frequently spot a so-called false breakout (false inside): the subsequent candle breaks the high of the inside candle, grabs the liquidity there (large asks appear but fail to hold), and ultimately, the candle closes below the entire inside formation. If you see absorbed volumes on a false breakout, you know the path is clear in the opposite direction.
Conclusion
Recognising reversal formations within a Footprint chart gives you a massive edge. Instead of guessing, you can determine exactly whether buyers were left trapped at the top or if someone is putting the brakes on the market with large limit orders.
However, all these patterns come with one major caveat: they do not work in isolation without the correct context. If you spot a textbook absorption in the middle of nowhere, the market will likely grind you down.
Therefore, in the third and final part of this series, we will bring everything together. We will learn how to identify magnetic zones (such as Unfinished Business – UB) and demonstrate a specific, proven entry setup that merges context and order flow into one cohesive strategy.


- As many Free Trials as you need
- Up to $200,000 account
- No time limit

Worldwide Reviews