


Limits of Technical Analysis. What to watch out for
Technical analysis is a very popular tool for traders and investors and can be a good help when deciding to enter a position. Like any other approach, technical analysis is not a self-contained solution without flaws and shortcomings. What should you watch out for with technical analysis?
Searching for the holy grail in trading or investing is pointless. There is simply no perfect approach in the market that will make money under any conditions without generating losing trades/signals. Investors and traders thus have a choice and can pick and choose which approach suits their style and their personality. Some may prefer technical analysis, some may prefer fundamental analysis, some may prefer a combination of both approaches, etc.
We have written about fundamental analysis in our recent article, today we will have a closer look at technical analysis. We devote plenty of space to it on our blog, and every trader should be familiar with the basic principles underlying technical analysis:
- all information about what is happening in the markets or what can influence the markets is priced in.
- history tends to repeat itself due to the herding behaviour of traders, and therefore various price formations and patterns can be used in the markets.
- price moves in trends and tends to stay in trends for some time.
- technical analysis shows traders what the price is. This is formed by the relationship between supply and demand.
Today we will look at what the limits of technical analysis are and what you should watch out for with it.

Does technical analysis work?
Technical analysis is a popular tool for forex traders and many cannot get enough of it. At the same time, there are many critics among investors and traders who say that technical analysis does not work. The reality is that technical analysis can be a very good tool in the hands of a more experienced trader, but it has limitations and restrictions. Therefore, when creating a strategy based on technical analysis, you must keep in mind that it is not a tool that will solve every problem.
Dependence on indicators
Many newcomers to forex, in an attempt to find the easiest possible path to profits, will believe that using all possible indicators will provide them with profits. Indicators can be a valuable addition when deciding on position entries, but relying on them alone usually does not lead to better results. The biggest problem occurs when a trader, for whatever reason, starts using too many indicators. Apart from confusion, such an approach will not bring him anything, because less is often more.
More experienced traders, on the other hand, try to keep the use of indicators to a minimum over time. They focus more on the price itself and may use the selected indicator only to confirm their signals.
Imperfection
Traders sometimes feel that the patterns and formations they have seen in training courses or in the literature are also present in the markets in perfect form and are visible at a glance. In reality, it takes quite a lot of experience and spending a lot of time studying charts to be able to identify the selected patterning in a way that will lead to profitable trading.
Similarly, for example, with support and resistance levels, which many traders believe to be exact values or lines on a price chart. In reality, however, these are areas where supply and demand from the big players in the markets meet. Understanding and adapting to the fact that not everything on a price chart is as perfect and ideal as in the training materials can save a trader a lot of money and nerves.
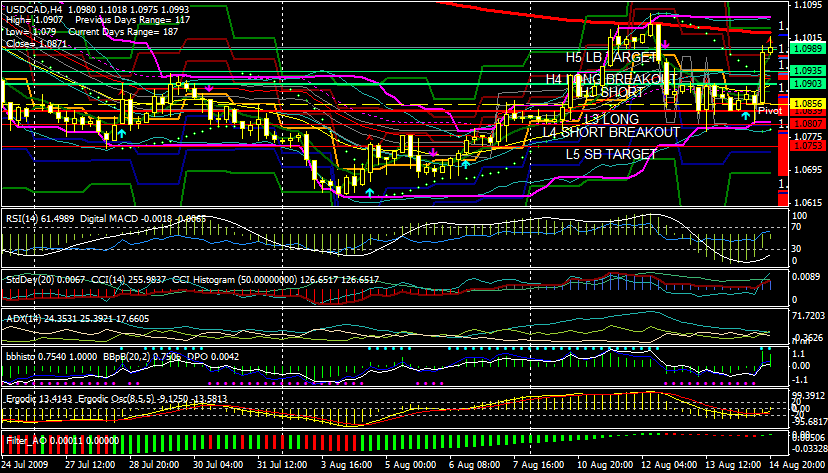
Time frames
Similar to the previous point, traders can follow price movements on different time frames, which give them different signals. A trader who focuses on short-term time frames, such as M5 or M15, may see price in a completely different context than a trader sees it on a four-hour or daily chart. In the first chart, we see the beginning of a downtrend on the H4 chart on the EURUSD pair.
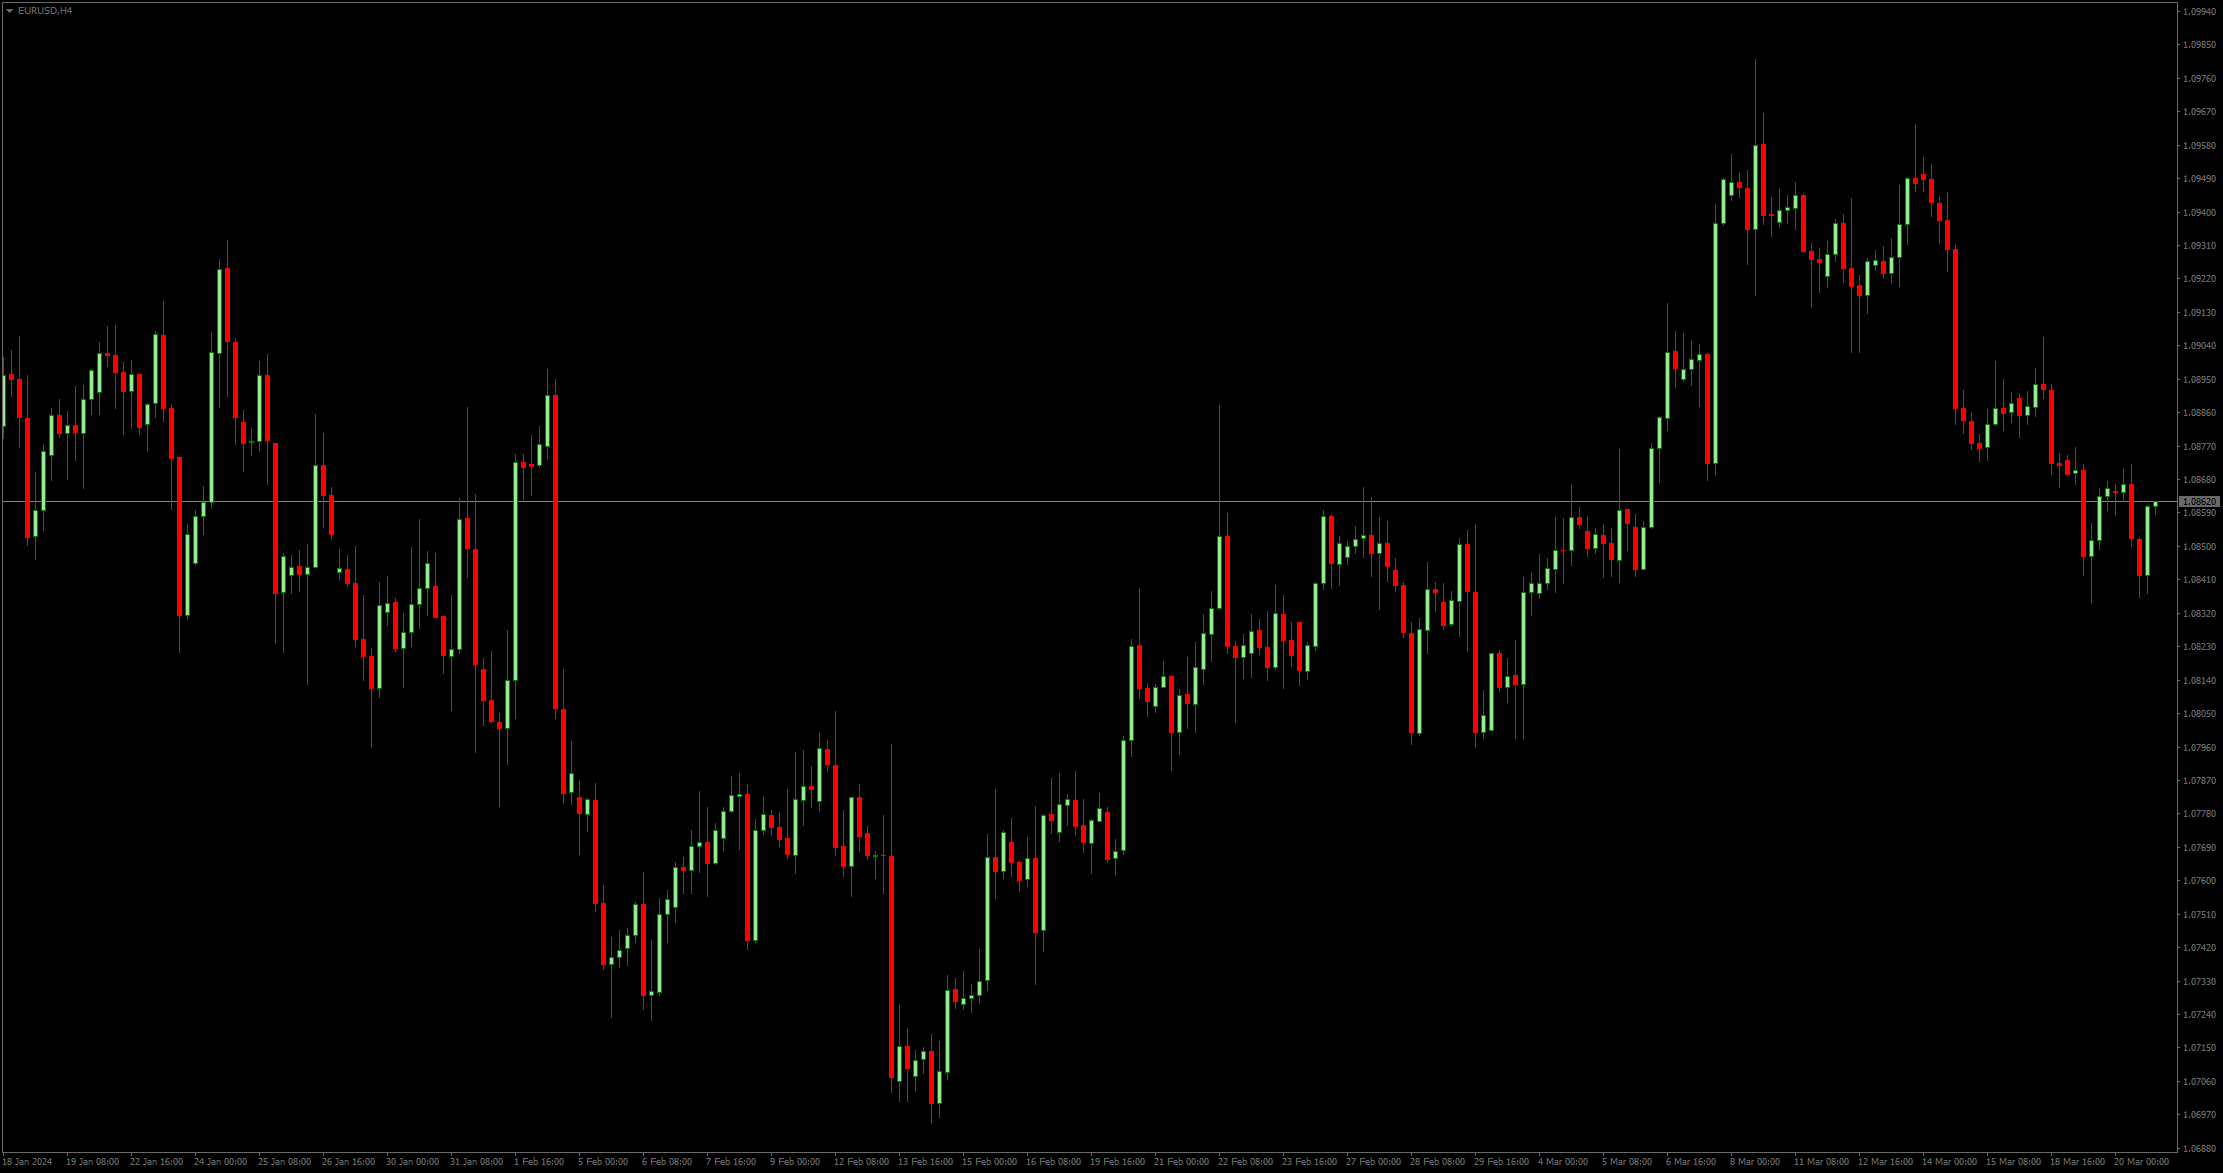
On the five-minute chart, however, we can see a strong uptrend that started after the bounce from the support level, at which the price moved in a narrow range for a while.

Especially for short-term traders who follow charts on smaller timeframes, it is advisable to look at how price is evolving over a longer timeframe before trading to get a broader perspective.
Ignoring fundamentals
In our article on fundamental analysis, we wrote that the ideal way to trade the markets is to combine both approaches and take the best of both. Yet many technical traders ignore fundamentals altogether. But fundamentals themselves have a very significant impact on price movements, and ignoring them completely can lead to unnecessary losses. Moreover, the significant volatility that occurs after the publication of important news can affect not only the price itself, but also the indicators on which investors base their trades. Keeping an eye on the calendar and knowing what is behind price movements is essential for long-term success.

Prediction capability
Technical analysis is based on historical prices. Based on these, traders then create the aforementioned patterns, or use various indicators to provide them with signals. However, there are various other factors at work in the markets that can influence price movements (e.g. fundamentals), so historical data may not always be the ideal tool. Technical analysis thus provides quite a lot of false and inaccurate signals. When you add to this the biggest weakness of popular indicators, which often lag behind the price itself, it can lead to unnecessary frustration for novice traders.
A subjective view
A subjective view of market events is a problem with any type of analysis. Different traders rely on different tools for their analysis, which they interpret in different ways. So at first glance, technical analysis may not seem to work because each trader sees different signals on the same chart. The solution, of course, is to establish clear rules, including market entries and exits.
The fact that sometimes a strategy generates losing signals for a certain period of time, leading to a significant drawdown, does not necessarily mean that it is a bad strategy. A trader should have tested and backtested his strategy on a large enough sample of data so that he should account for such a scenario. At the same time, a strategy that works great during trend periods may not perform well during periods when markets are range-bound (and again, this gets to the differences between time frames).
In conclusion, we need to be clear that this article is not meant to denigrate technical analysis and discourage you, the trader, from using it. Rather, it is a reminder to less experienced traders not to put too many expectations into technical analysis and not to consider it as the only and definitive solution that will lead them to wealth. Trade safe!


- As many Free Trials as you need
- Up to $200,000 account
- No time limit

Worldwide Reviews