


What’s behind the price movements in the markets

There are many factors and events that influence the price movements of financial instruments in forex and other financial markets. Ultimately, however, the main driver of prices in any market (not just financial markets) is the fundamental relationship between supply and demand.
What happens in financial markets such as forex, commodities, etc., is influenced at first glance by macroeconomic data, central bank actions, the geopolitical situation, or changes in market sentiment. When there are significant moves in the market, analysts try to explain it from a fundamental (surprise news) or technical (breaking/reaching an important S/R level) standpoint, or due to market sentiment.
In reality, the price and its movements are influenced by supply and demand, or sellers and buyers trying to find a fair value for the asset. This interaction between market participants takes place almost constantly, and forex traders can perceive it through charts, where the price moves in trends or ranges.

Supply vs Demand
The movement of price is not caused by the excess of supply over demand and vice versa, because every seller must have a buyer. Rather, it is the degree of aggressiveness or willingness to sell (or buy) at a higher or lower price.
There are several tools we can use to see how these movements in the markets arise, where we can monitor the volume or liquidity in the markets. As forex is an OTC (Over The Counter) market and is decentralised, data on volume, executed trades or liquidity on currency pairs and with CFDs is not easily accessible to ordinary traders. Traders have to pay for it or access it through their broker or third-party services, or they can download extensions to their platform that can be a good alternative to paid tools.

Volume
The volume of trades shows us the number of positions that have been executed in the market. Many traders consider the volume of trades to be one of the most important indicators besides the price of the asset itself. A large volume can indicate a significant price movement because a large volume of orders (market order) entering the market can mean a significant price movement. On the other hand, a large volume of already traded contracts at a certain price or pending orders (limit order) may represent an interesting support/resistance level to which the market likes to return.
In addition to the classic volume display on a chart, order flow, or footprint charts, are often used today, which show the number of executed bid and ask positions at each price level in addition to the price. The numbers on the left hand side show sellers who have reduced demand, the numbers on the right hand side show buyers who have increased supply. Unfortunately, we can’t find this tool in regular applications, but traders can use platforms like NinjaTrader (image below), or download add-ons (in this article we write about an add-on for the cTrader platform).

Liquidity
Liquidity in the form of pending (limit) orders also has a very significant impact on the price, and its dynamic development reveals the aforementioned aggressiveness of sellers and buyers. Liquidity in the markets can be monitored through pending orders, which can be seen in the order book. Here again the problem is that this tool is not available in the applications for regular traders, and therefore it requires the use of additional tools, as can be seen in the image below (Free Trader Ladder (gemify) v0.4.1. – plugin for NinjaTrader 8).

Liquidity in the market is a very important indicator that affects volatility. When there is enough liquidity in the markets, market movements do not have to be significant and there are no slippages because there are enough participants in the market and at each price level there are enough traders to form a counterparty in the trade. A lack of liquidity often leads to significant short-term movements and possible slippages because there are not enough counter orders at certain prices and the trade may not be executed at that price.
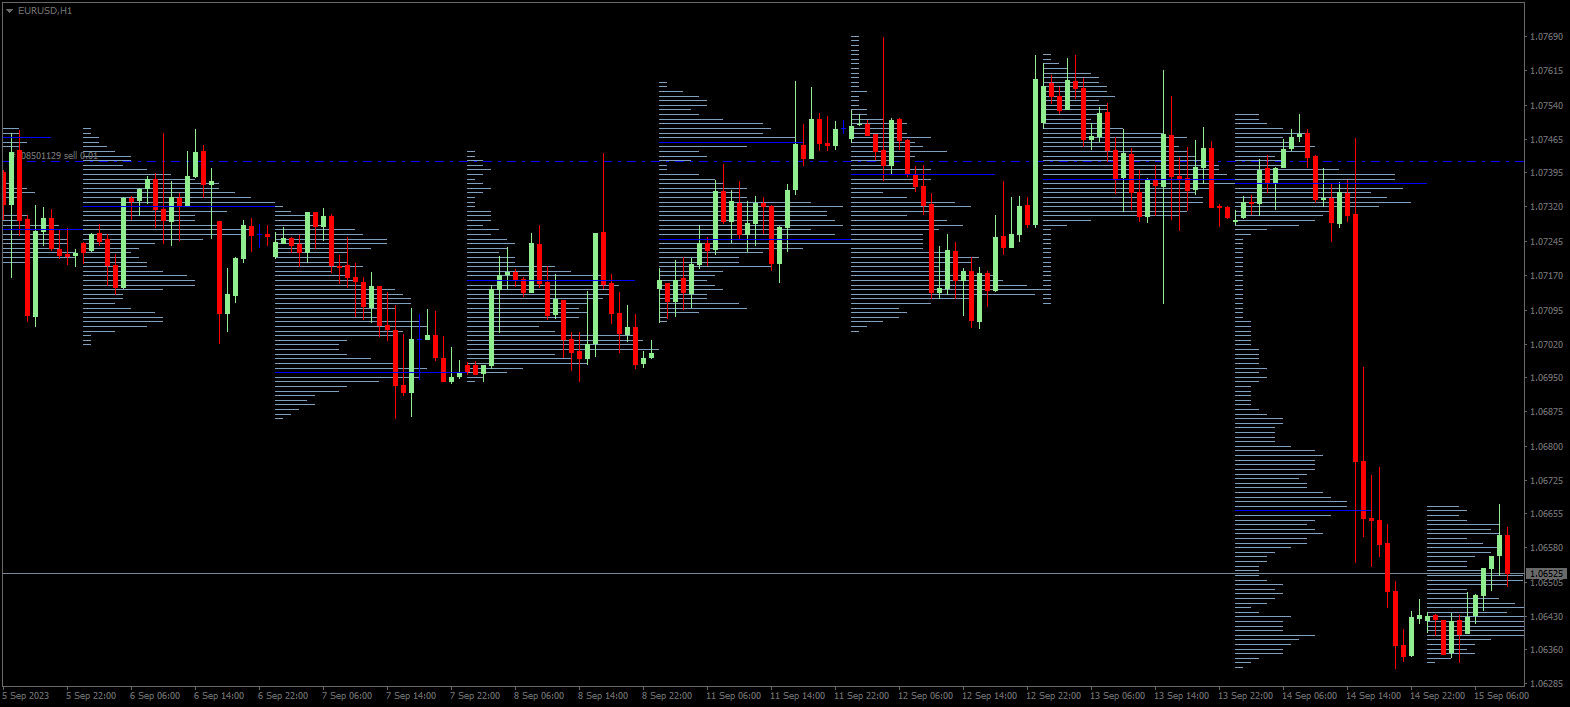
The next chart shows how volume and liquidity affect the resulting asset price. At levels where there is both sufficient liquidity and a sufficient number of traders willing to execute their trades at a given price, price movements are not significantly off the average. The most significant movement then occurs in the area where we see the lowest volume. This is because there were not enough orders at those price levels because traders were not interested in trading there, and those who did enter the market did not find a counterparty.
The view of the markets in terms of liquidity, current dynamics of pending and market orders and volumes already traded at price is used by professional traders and big players who move the market. With their help, it is possible to follow their tracks and estimate their intentions. The tools and visualizations of these activities can be used for scalping and trading on larger timeframes. But this approach requires knowledge of theory but above all, hundreds of hours of live chart watching.
More on Orderflow and Volume profile articles here.


- As many Free Trials as you need
- Up to $200,000 account
- No time limit

Worldwide Reviews