The Sharpe ratio tracks not only returns but also risk
Most traders and investors focus only on returns when evaluating their portfolio or strategy. However, they often forget about the risk involved in achieving those returns. That's why our MetriX app now includes a Sharpe ratio that assesses traders' performance in relation to the risk they take.
It is quite difficult to objectively assess the success of instruments in the financial markets. The profitability of an investment instrument may not be indicative of the risk an investor has to take when investing in it.
It's not just about yield
The same applies to Forex trading. One trader can make tens of percent in a month, but he opens large positions and takes disproportionate risks. Another trader takes a much more conservative approach, his risk per trade is not too large, but he is also not making substantial returns. In the long run, however, the second approach may be more efficient and can bring better results.
This is also why risk management rules (Maximum Loss and Maximum Daily Loss) are among the most important conditions for maintaining an FTMO Account, and why we are constantly introducing new tools in our Account MetriX application to evaluate the success of a strategy to help traders achieve better results.
What is the Sharpe ratio?
There are several indicators that take into account risk in addition to performance, and one of the most well-known indicators is the Sharpe ratio. It was created by an American economist and Nobel Prize winner William Sharpe in 1966. Although he himself called it the "reward to variability ratio", the ratio eventually became known among economists as the Sharpe ratio and the name was updated by the author himself in 1994. The Sharpe ratio is now used to measure the profitability of an investment or portfolio (often used to evaluate mutual funds) with regard to the degree of risk taken.
Calculation
The formula for calculating the Sharpe ratio is quite simple:
SR = (average return - risk-free return) / standard deviation
The formula shows that the Sharpe ratio expresses the degree of premium of an investment to the risk taken. The higher the value, the better. A negative value means that the investment instrument is unable to beat even the return of risk-free instruments, which is obviously bad.
Instead of the average return, we can use the total return over a certain period; the risk-free return can be considered to be the return on government bonds, etc. The standard deviation is then an indicator of the risk or volatility of the investment instrument over the period of time.
Sharpe ratio and Forex
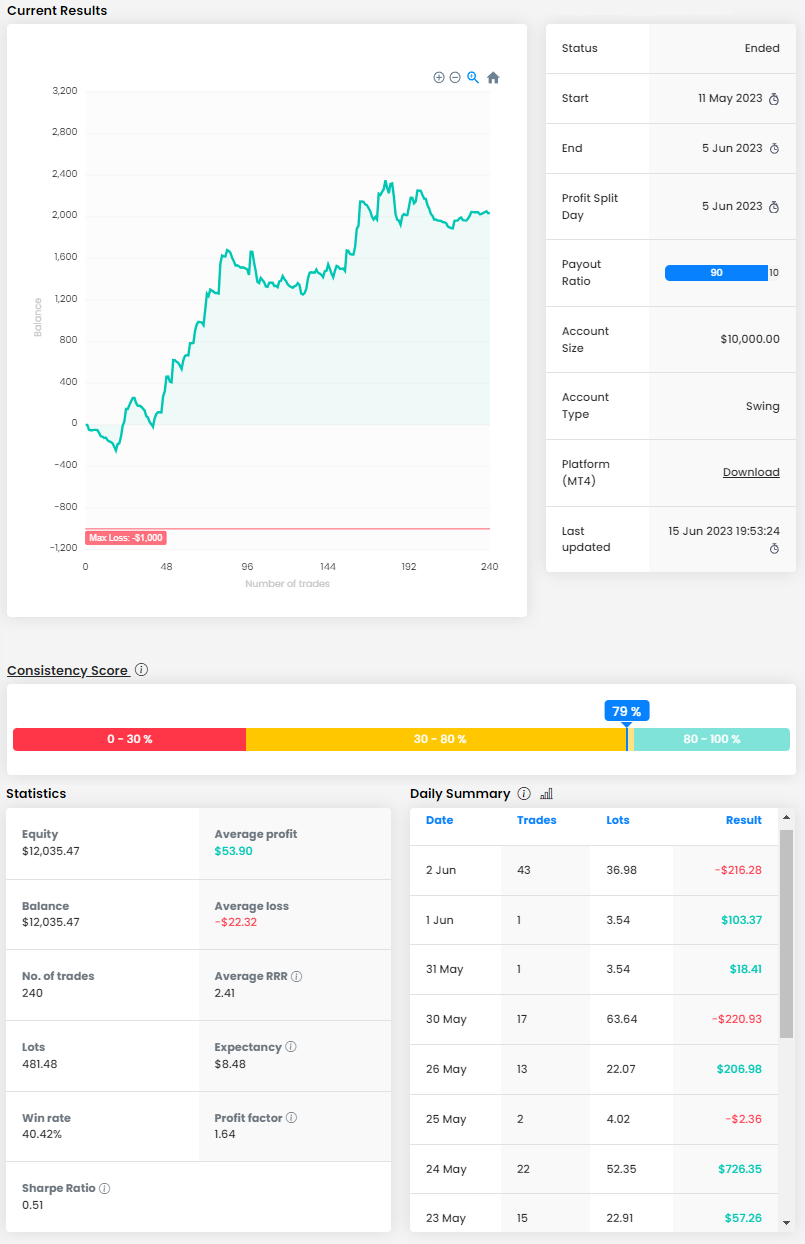
The Sharpe Ratio can also be used to evaluate the effectiveness of a strategy in the Forex market and is a good indicator of whether the profit achieved by a given strategy is worth the risk taken. Unlike other investment assets, the risk-free return in Forex would be difficult to determine. For this reason, we only use the returns for a given period for the Sharpe Ratio in Account MetriX. This is then divided by the volatility, which is represented by the standard deviation of the returns on that account. Since we assume a maximum period of two months, we take into account the standard deviation of the daily returns.

If two different strategies have the same return but different Sharpe ratios, this may mean that the strategy with the higher Sharpe ratio has a lower risk, which is the better case, as can be seen in our example above. The trader may be one of those scalpers who open a large number of positions, but he has the risk under control, has a fairly consistent approach, and has managed to make more than 20%.
In a less ideal case, a higher Sharpe ratio can be achieved by increasing returns, but this usually means taking more risks, which can lead to significant drawdowns. Thus, FTMO Accounts are at a greater risk of violating the Trading Objectives and having their account deleted.
Drawbacks
There is probably no ideal tool for measuring the performance and efficiency of an investment, and the Sharpe ratio is no exception. One of the drawbacks is that different values can be substituted for different variables. In the classic version, we can use the discount or deposit rate as the risk-free return, but in Forex this value does not have to be there at all. This of course affects the results.
The Sharpe ratio also has the problem of asymmetric risk and misjudges maximum fluctuations. Instruments that experience one period with a significant loss will have a better Sharpe ratio than an investment instrument with average volatility (and have a better overall return). Therefore, this tool is not well suited for evaluating hedge funds or options.
Conclusion
Like any other similar tool, the Sharpe ratio is not a catch-all indicator and should be used in combination with other tools that can help evaluate the effectiveness of a portfolio or strategy. However, it is certainly an interesting metric that can assist investors and traders in evaluating their strategy and implementing changes to improve their results.
About FTMO
FTMO developed a 2-step Evaluation Process to find trading talents. Upon successful completion you can get an FTMO Account with a balance of up to $200,000. How does it work?.


