


Market Profile: Master the 80% Trading Strategy & Hidden Magnets

In the previous two parts, we built a solid foundation. You already know how the market creates a fair price zone (Value Area) and how the type of market open and Initial Balance (IB) define the character of the trading day.
Today, we will complete this puzzle. We will look at the “invisible” footprints on the chart that reveal where the market left unfinished business and where the price is highly likely to return. Welcome to the finale of our series, where theory turns into specific trading setups.
Market Anomalies: Where the Market Left “Unfinished Business”
The market is not always perfect in its auction process. It often leaves footprints behind, telling us that one side (buyers or sellers) was violently stopped at a certain moment or that the price just flew through a certain zone without interest. These anomalies act as so-called magnets for the market, and the price has a very strong tendency to return to them over time.
1. Unfinished Auction (Poor High / Poor Low)
A normal profile should ideally end at its top or bottom with a single TPO letter, which indicates that the buying or selling interest has dried up, thus forming the market’s top or low.
- Anomaly: If the profile ends “chopped off” – meaning two or more half-hours (TPOs) have a high or low at the exact same level, and these levels must form an absolute extreme (high or low of the day, week, month, etc., depending on your style and the monitored profile) – it is called Unfinished Auction (poor high/poor low).
- Meaning: This means the auction process was not completed, and the market tends to return to these levels to complete the auction. If you see 2 to 3 such auctions, for example on the S&P 500 instrument, there is a 70–80% chance that the market will revisit them within 2 to 3 days.

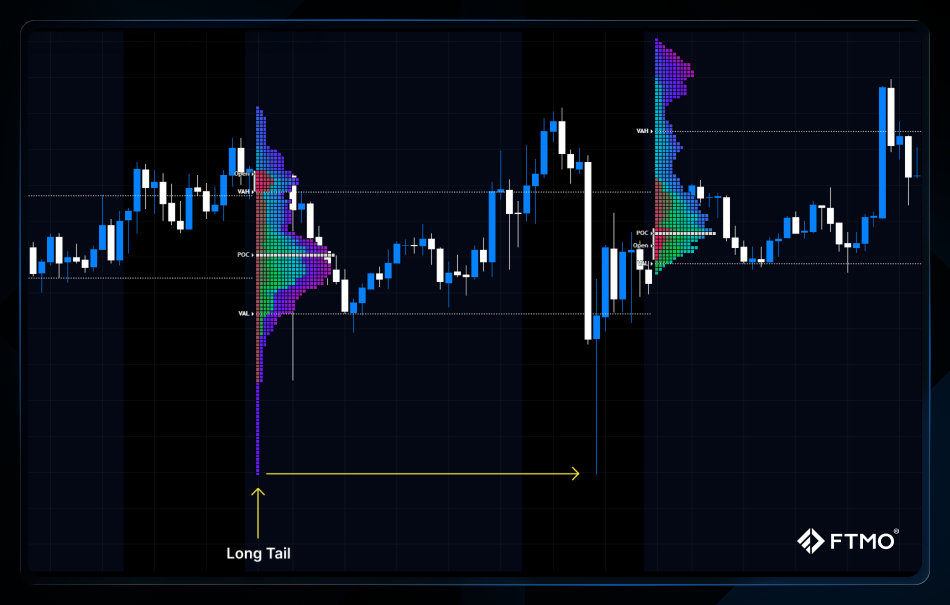
2. Tails (Buying/Selling Tails) and Single Prints
- Tails: Imagine them as long “tails” consisting of a single column of letters at the very top or bottom of the profile. They occur when the price sharply reaches a new level, but immediately meets massive resistance and flashes back.
- Buying tail (at the bottom): The price dropped, but large buyers immediately and aggressively pushed it back up. This area becomes a very strong support for the future.
-
- Selling tail (at the top): The price rose, but sellers immediately knocked it down. This area will act as strong resistance (a ceiling).
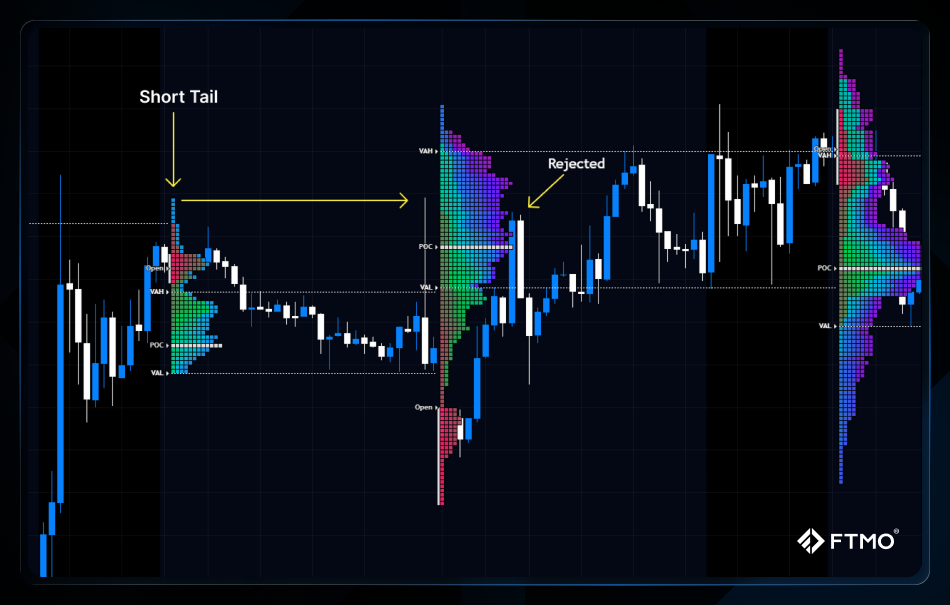
Basic rule: The longer this tail is, the more decisively the market rejected this price, and the stronger the barrier created for the future.
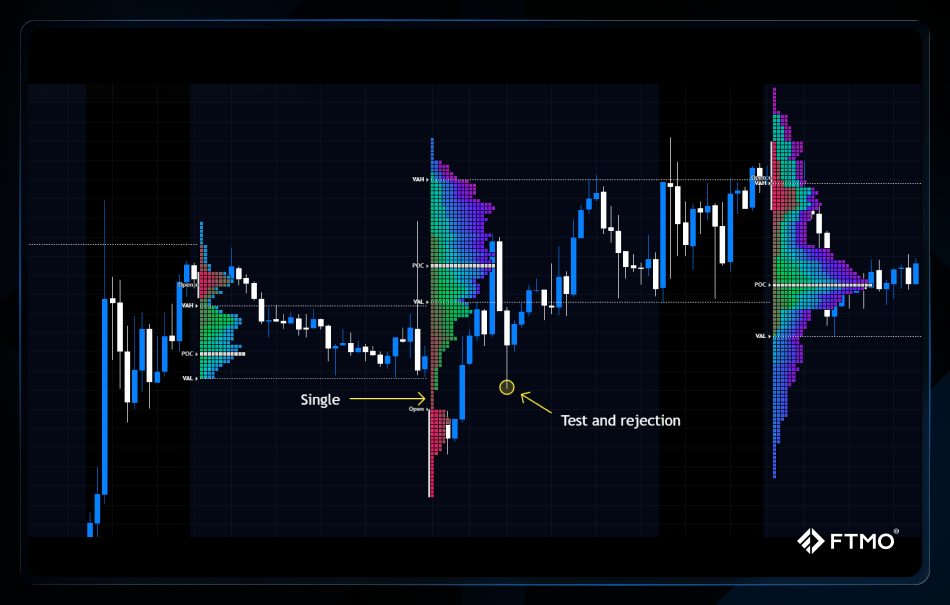
- Single Prints (Singly): Areas inside the profile that are only one letter thick. From the perspective of classic price action, these areas often represent Fair Value Gaps (FVG) and serve as strong supports or resistances. In the future, the market will either flash through these areas or gradually start “filling” them with volume.
3. Ledge
Occurs when two or more TPOs stop at the same price level inside the profile (not at the edges). The larger this ledge is (the more letters next to each other), the stronger the support or resistance it represents. Logically, it follows that the largest “ledge” in the entire profile is basically the POC (Point of Control), i.e., the place where trading occurred the longest.
Market Magnets from the Perspective of Volume Profile
In the Market Profile and the integrated Volume Profile, there are points that act as a magnet for the price. Professionals use these levels as target points (Take Profit) or areas where they expect a reaction.
- Untested VPOC: The point with the highest trading volume from the past that the market has not yet visited since its creation is one of the strongest magnets.
- LVN (Low Volume Nodes): Zones with minimal volume. The market will either sharply bounce off them or use them as a “highway” to the next significant level.
- Value Area (VAH and VAL): Previous fair value areas (most commonly monitored from the previous day, week, or month) are key magnets and strategic levels. Depending on where the market opens or where it currently is relative to these previous VAs, their boundaries (Value Area High and Value Area Low) serve as strong supports and resistances or help determine the current trend. For example, if the market opens above the previous day’s VAH, it signals a bullish trend.
The Famous 80% Rule Setup
Now the essentials: how to translate this information into profitable trading? Based on widely known statistics and the long-term experience of professionals, there are proven scenarios with a high probability of success.
Scenario: The 80% Rule (Return to VA) This is one of the best-known setups popularised by veteran trader Jim Dalton in his classic book Mind Over Markets, which in classic Market Profile theory is among the most popular and statistically robust.
Note: The Value Area in this rule primarily relates to the Market Profile (TPO), but many professional traders use this setup with the Value Area from the Volume Profile as well.
- Long (Towards VAH): The market opens below the lower boundary of fair value (VAL). If the price subsequently returns above the VAL and manages to safely hold above it for two consecutive TPO blocks (i.e., 60 minutes), there is an 80% probability that the market will fill the entire value area and test the upper boundary VAH.
- Short (Towards VAL): The market opens above the upper boundary (VAH). If the price drops back below the VAH and stays below it for two consecutive TPO blocks (i.e., 60 minutes), there is an 80% probability that the market will reach the VAL.
Warning: On the way to the target, the central point POC (Point of Control) is always the biggest obstacle and the first strong S/R zone where many traders take partial profit (TP1).
Conclusion
Market Profile is not the “holy grail”, but it is one of the best tools at your disposal. It does not draw lagging indicators on your chart; instead, it shows you the real auction and the behaviour of institutional players in real time.
By understanding where the market finds fair value and where, conversely, it leaves anomalies, you gain a map that most retail traders do not see. Your success in the market now depends on your patience to wait for the right context.


- As many Free Trials as you need
- Up to $200,000 account
- No time limit

Worldwide Reviews