


Technical analysis – what’s the magic of RSI
After looking at three indicators that worked with emerging trends in different ways (or combined them with momentum and volatility), today we’ll talk about one of the most popular oscillators, the Relative Strength Index, and where it can come in handy.
The Relative Strength Index (RSI) is one of the most popular and widely used oscillators. It was developed by a well-known technical analyst J. Welles Wilder Jr. and, along with several other indicators, was first published in 1978 in the book “New Concepts in Technical Trading Systems”. The RSI is a momentum oscillator that measures the direction and trend dynamics of an investment instrument and determines how quickly its price has changed over a certain period.
The simplest way to calculate the RSI indicator is as follows:
RSIt(n)=100-[100/(1+U(n)/D(n))]
U(n) – average profit over n periods
D(n) – average loss over n periods
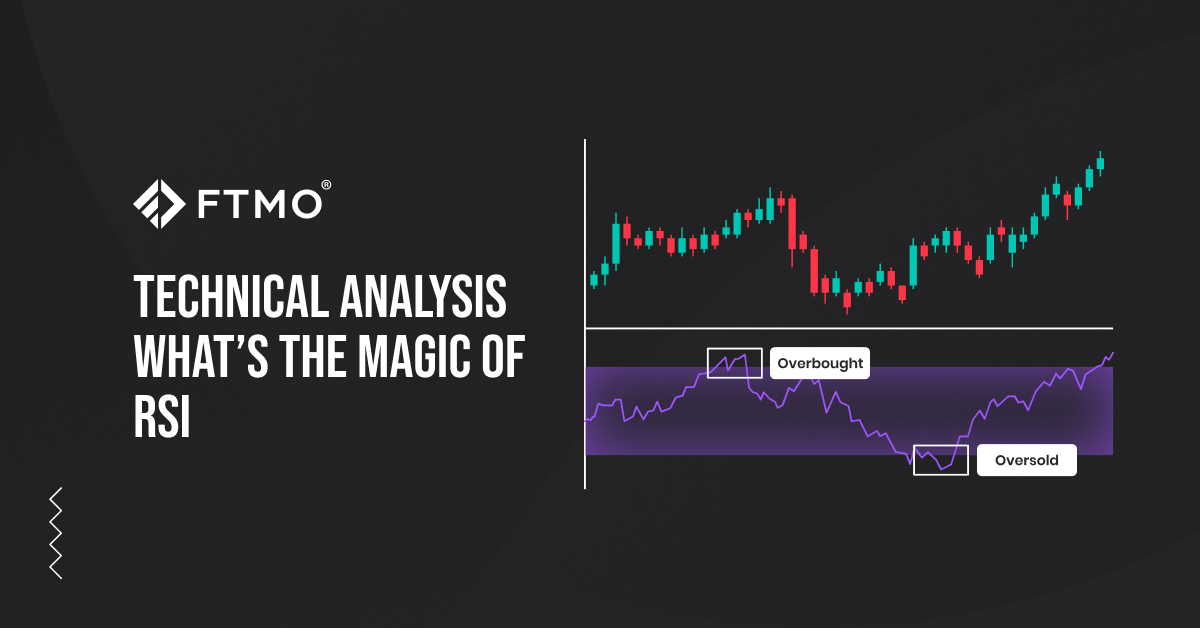
The indicator is displayed in a separate chart window and its line moves (oscillates) between the values 0 and 100. When calculating U(n) and D(n), the smoothed or modified moving average (SMMA) or exponential moving average (EMA) is used. In the basic setting, the number of periods is set to 14 and the levels of overbought and oversold markets are formed by lines at the values of 70 and 30 points.
Oversold vs. overbought
The basis of Wilder’s assumption was that if the price of an instrument rises too quickly, at some point the instrument may be considered overbought; if, on the other hand, the price falls quickly, it will be considered oversold. This is the basis for the simplest use of this indicator, i.e. selling the instrument when the price is above 70 and buying the instrument when the price is below 30.

The disadvantage of this approach is that when the trend is strong, the price may get above 70 (or below 30) quite often and the indicator may generate false signals. Some traders solve this by moving the thresholds to 80 and 20, but overall, this basic approach works better in markets that are not trending and move sideways (like most oscillators).
Divergence
Another way to use RSI is divergences. Wilder considered the divergent movement of the indicator and the RSI to be a very strong indicator of a trend change. Thus, when prices form new higher highs on the instrument’s price chart, but the RSI forms lower highs, it is a signal that the price will soon start to fall, and thus a bearish divergence (we can see in the chart below). Conversely, when prices form new lower lows and the RSI forms higher lows, it is a bullish divergence, i.e. that the price will soon start to rise.

Trends Trading
Although most traders do not consider RSI as a trend indicator, it can be used for trend trading. Analyst and trader Andrew Cardwell has come up with a use for the RSI indicator during trend periods. According to the basic interpretation, the market is in an uptrend when the RSI is above 50 points and in a downtrend when it is below 50 points. However, Caldwell introduced ranges to help better determine what trend the market is in. So when the RSI is between 40 and 80 points, the market is in an uptrend, when it is between 60 and 20 points, it is in a downtrend.
Other ways of use
Another way to use RSI is by drawing trend lines directly into the RSI chart, whereby its breaking (crossing the RSI line and the trend line) indicates a change in trend. Crossing two RSI lines with different periods can also be used to find entry prices, similar to crossing moving averages, etc. Traders often modify the lines to show overbought and oversold markets, or use shorter or longer periods instead of 14 periods.
Like any other indicator, the RSI has its strengths and weaknesses. For those who can use them to their advantage, it can be a very valuable technical analysis tool. The ideal way to use it is to combine it with other tools to achieve even better results.


- As many Free Trials as you need
- Up to $200,000 account
- No time limit

Worldwide Reviews