


Technical analysis – what does Accumulation/Distribution tell you?

Trading volumes, together with price action, are one of the basic sources of information that traders can use when trading the financial markets. Another indicator that we would like to discuss in our series, that takes into account trading volumes in the markets, is called Accumulation/Distribution.
Although price action is the main source of information on price movements for most traders, trade volume data can provide traders with additional information on what is driving price movements in particular investment instruments. Indicators that use volume as one of the main variables in their calculations are based on the assumption that a change in the trading volume of an instrument leads to a subsequent change in the trend of the instrument’s price.
Accumulation/Distribution vs On Balance Volume
In one of our recent articles we wrote about the On Balance Volume indicator, today we will write about one of its “relatives”, which is the Accumulation/Distribution indicator. We should point out here that some applications (for example, cTrader) offer traders a similar indicator by Larry Williams (Williams Accumulation Distribution), however, it has a simpler calculation. The indicator we will describe today (sometimes also referred to as the Accumulation/Distribution Line) was developed by well-known stock analyst Mark Chaikin, who originally referred to it himself as the Cumulative Money Flow Line.

The indicator expresses the relationship between price and the cumulative flow of money into and out of the investment instrument and, as the name implies, accumulation indicates the level of demand for the investment instrument (i.e. purchases) and distribution refers to the supply of the investment instrument (i.e. sales). As already mentioned, the Acc/Dist Line (ADL) is similar to the On Balance Volume (OBV) indicator, as in both cases they are moment indicators that allow us to evaluate the differences between price movements and volume flows.
The ADL indicator is displayed in a separate window, and like the OBV, it is a cumulative indicator that does not oscillate between 0 and 100. However, the difference is in the calculation. OBV only takes into account whether the closing price from the previous period is higher or lower than the closing price of the current period. Accordingly, it then adds or subtracts the entire volume from the previous value.
Calculation
The calculation of ADLs is slightly different from that of OBVs and at first glance may seem quite complicated. On the other hand, it can be said to represent the relationship between volume and price movements in a more complex, and for many analysts, better way. The calculation uses a multiplier that acts as an indicator of how strong the purchases and sales of an instrument are over a given period.

The first to be calculated is the so-called Close location value (CLV), also referred to as the Money Flow Multiplier in some formulas. It serves as an indicator of where the instrument’s closing price is in relation to the price range in a given period. CLV values range from +1 to -1, with a larger positive value indicating that the closing price is closer to the maximum, and a larger negative value indicating that the closing price is closer to the minimum. The CLV calculation looks like this:
CLV = (Close – Low) – (High – Close) / (High- Low)
Close = closing price
High = maximum price for the period
Low = minimum price for the period
Then it is necessary to work out the money flow volume (MFV) for the given period, which is obtained by multiplying CLV and volume (V). A negative value means that money is flowing out of the instrument, and a positive value means that money is flowing in.
MFV = CLV x V
Since it is a cumulative indicator, the value of the ADL indicator itself is obtained by summing the previous ADL value and the current MFV value.
ADL (i) = ADL (i-1) + MFV (i)
Use of the indicator
Similar to OBV, ADL gives us a picture of the change in demand and supply, or whether selling or buying pressure is prevailing in the market, by tracking trading volumes. Since it takes into account, among other things, the closing price in the calculation, it gives us a picture of how large institutional investors behave in the market. In general, retail investors are more active when the market opens and, conversely, institutional investors are more active before it closes.
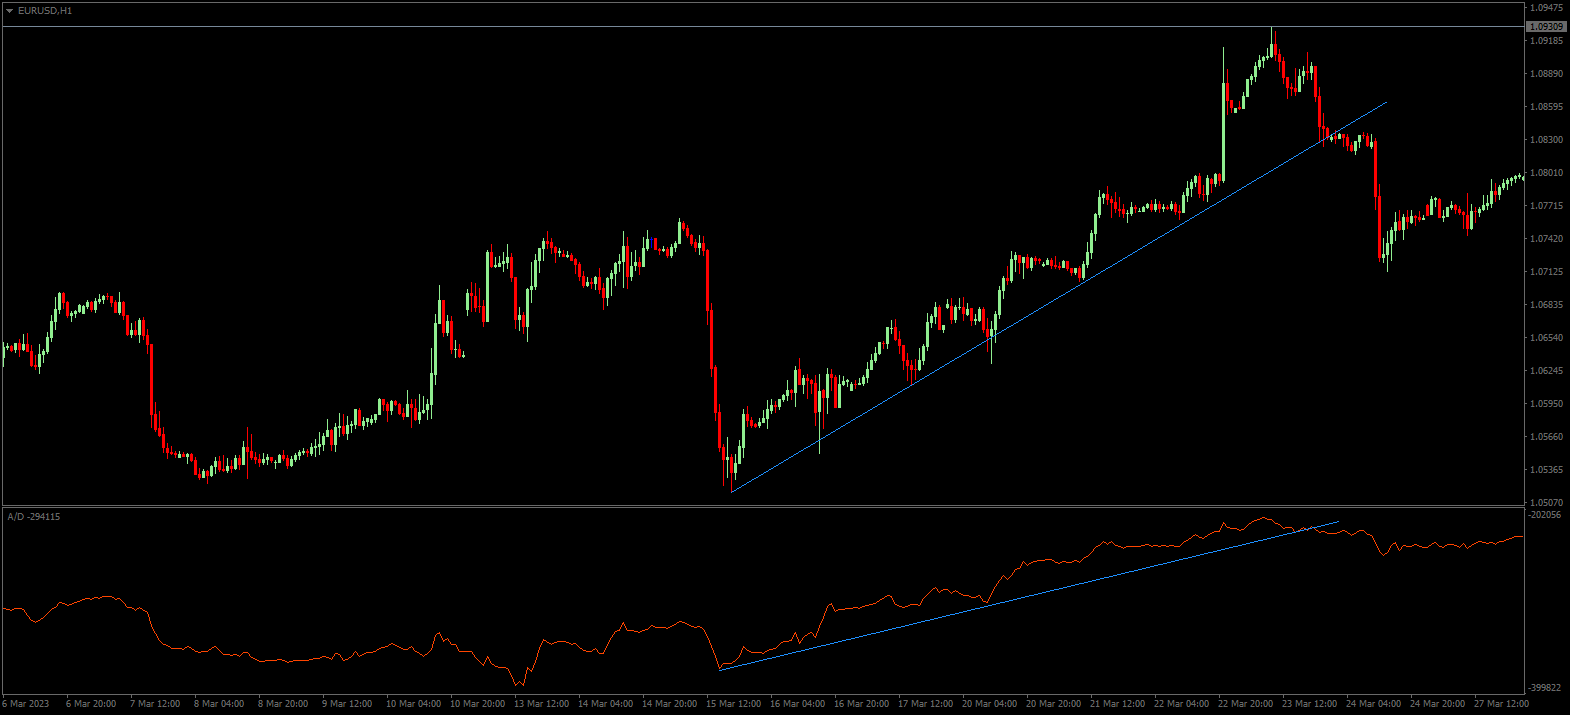
Thus, when the indicator and the instrument prices are moving in the same direction, the ADL can act as a confirmation of the strength of the trend, indicating that sellers (downtrend) or buyers (uptrend) have an edge in the market.
Similar to OBV, ADL can act as a confirmation of a break of support and resistance levels. Thus, when a certain price level is broken on the price chart, even on the ADL chart, it can be a signal that this change is supported by a change in trading volume, which amplifies the signal to enter the market.
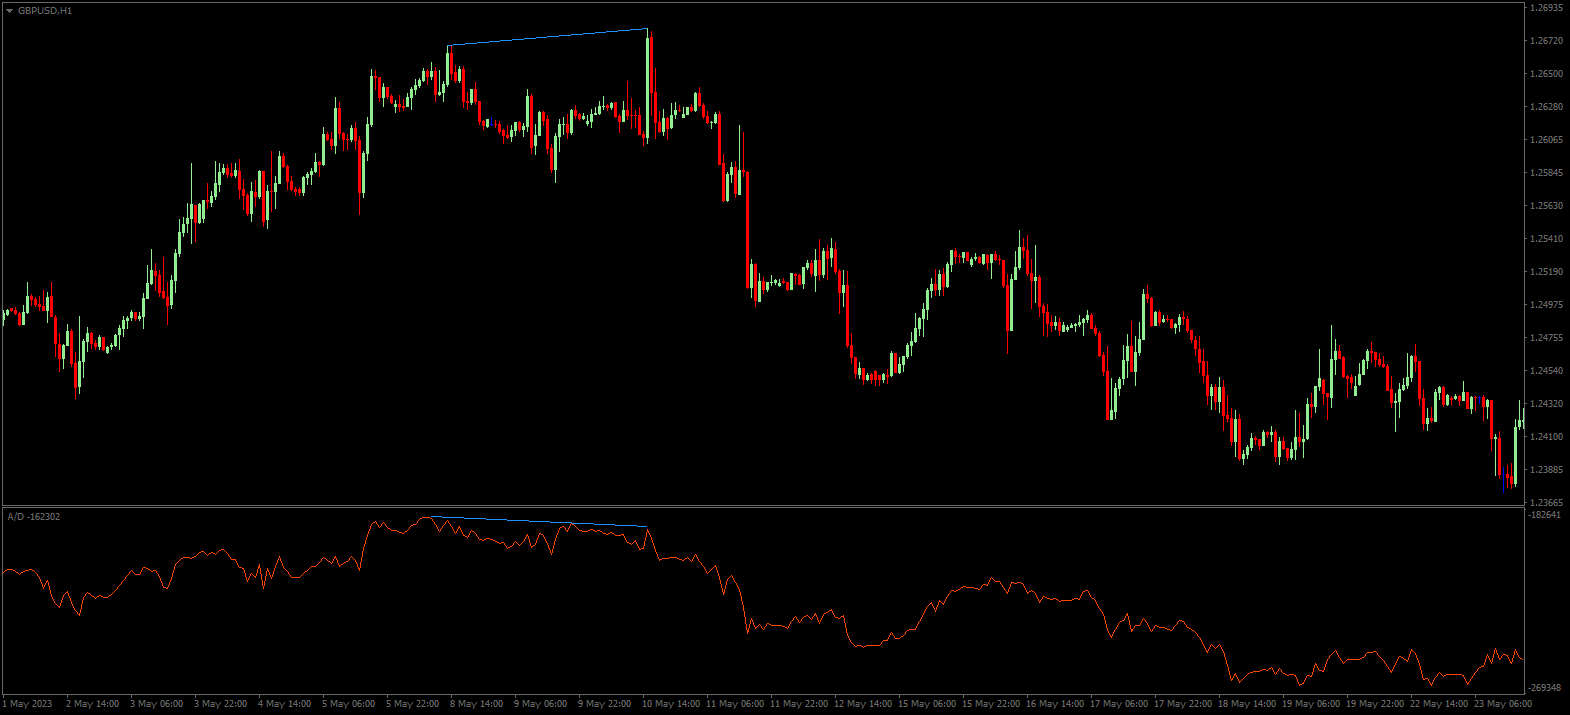
Divergence
Probably the most common use of the ADL indicator is divergence. Thus, when new price highs are formed on the price chart but the price fails to form new highs on the indicator, it means that the price is not supported by the volume growth and a reversal may occur. We can look at this as evidence that large institutional investors are already starting to sell and are looking to take advantage of the maximum price. Similarly, in a downtrend, when the price is making new lows, however, new lows are no longer being formed on the indicator. This may be a signal that institutional investors are starting to buy at low prices, so the trend may be reversing.
Disadvantages of ADL
Traders who use ADL must be aware of some of the pitfalls associated with this tool. Since the indicator only takes into account the closing price in a given period, it is prone to errors. For example, gaps can be dangerous, where the price can drop by as much as 15% on high volumes. It will subsequently end up at the top of the range during the period, but will be still several percent in the red compared to the previous period. However, the value of the indicator will rise, and high volume can mean that the rise will be quite large, creating quite a big discrepancy between the price and the indicator.

As can be seen from the last paragraph, as with other indicators, the ADL should not be used in isolation, as the only tool generating entry or exit signals. As interesting as it can be, it is a good idea to combine it with other technical analysis tools to enhance the results.


- As many Free Trials as you need
- Up to $200,000 account
- No time limit

Worldwide Reviews