


Technical analysis – On Balance Volume relies on volumes

On Balance Volume is a technical indicator that, in addition to the price of the financial asset itself, also takes into account trading volumes in its calculation. Thanks to this, it can be used both in confirming trends and in detecting breakouts.
Trading volumes are one of the most important factors influencing price movements for many traders in the financial markets. The fact that rising trading volumes are usually a sign of an emerging trend is nothing new, so it is only logical that traders look for ways to use this market variable to their advantage.
What is On Balance Volume
Analyst Joseph Granville was one of those who believed that volume was one of the key factors affecting the price of a stock (or investment instrument). He described the On Balance Volume indicator which used trading volumes to monitor the behaviour of market participants and thus predicted price movements and momentum in his book “Granville’s New Key to Stock Market Profits” in 1963. The construction of the indicator was based on the idea that when the market experiences an increase in trading volume, the price will subsequently experience a significant upward or downward movement.
The indicator was originally developed for stock trading, however, is now commonly used by traders in other markets. For Forex traders, one of the limitations in using volume may be the fact that in Forex, which is not a centralized market, we do not have access to the actual trading volume values, but rely on tick volume. This is less accurate, but as we showed in an earlier article, it can be used.
Calculation
Just like the oscillators the On Balance Volume indicator is displayed in a separate window, but it does not oscillate between 0 and 100 and its absolute value is not that important. It is a cumulative indicator that tracks whether the trading volume on an asset is increasing or decreasing, in addition to the asset price.
Its calculation is relatively simple.
If the current closing price is higher than the previous period’s closing price, then the trading volume for the current period is added to the previous indicator value.
OBV(i) = OBV(i-1) + Volume(i)
If the current closing price is lower than the previous period’s closing price, then the volume of trades for the current period is subtracted from the previous indicator value.
OBV(i) = OBV(i-1) – Volume(i)
If the current closing price is the same as the closing price of the previous period, the value of the indicator does not change.
OBV(i) = OBV(i-1)

Use of the indicator
The problem many traders and opponents have with OBV is that they believe the indicator adds no value to the price action itself. It is true that when the market trend is strong, the price and the indicator see similar movements because the price movement is supported by the increasing volume of trades in the markets. However, in this regard, the OBV indicator can act as a trend confirming tool as seen in the figure below. Since the indicator is not based on price averaging, such as moving averages, but is influenced by the growth in volumes that represent the behaviour of large investors, it can perform this role very well.
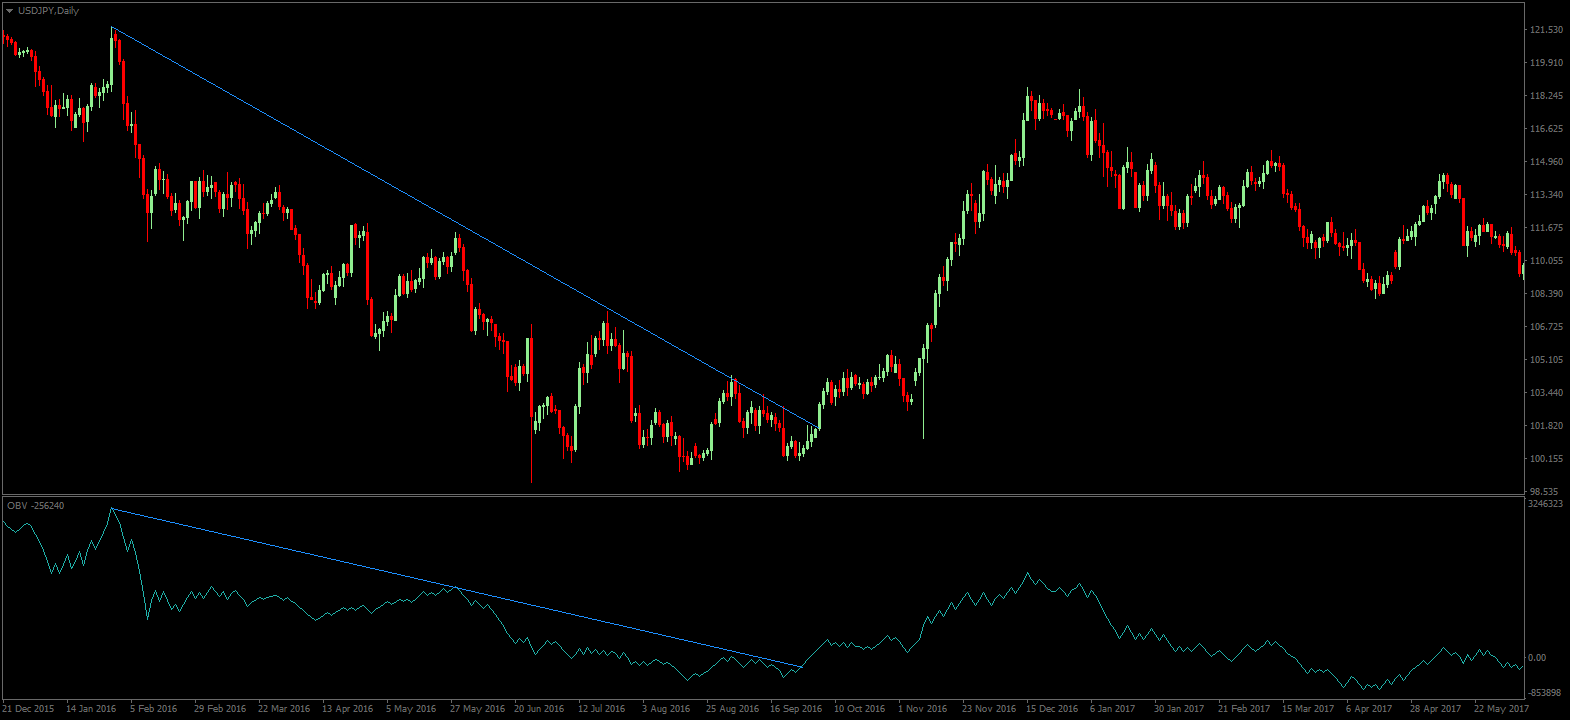
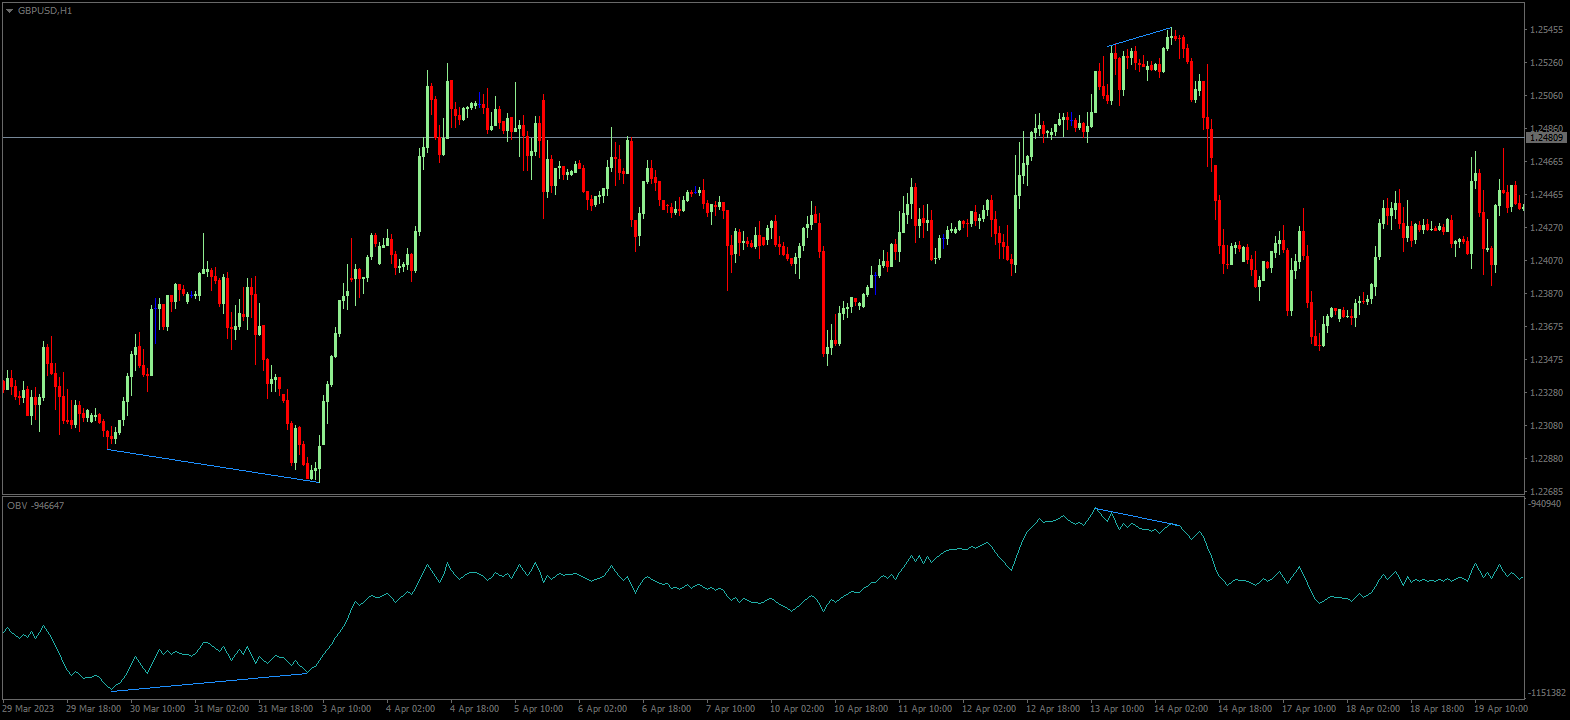
Divergence
When the trend on the price chart continues even when the trading volume drops, there are irregularities in the market that traders can also use to their advantage. Similar to oscillators, divergences can be used with the On Balance Volume indicator, which in this case have even more telling value than in the case of oscillators. Thus, when the price records higher highs and the OBV indicator records lower highs, it is a sell signal. Conversely, when the price makes lower lows but the indicator shows higher lows, it is a buy signal.
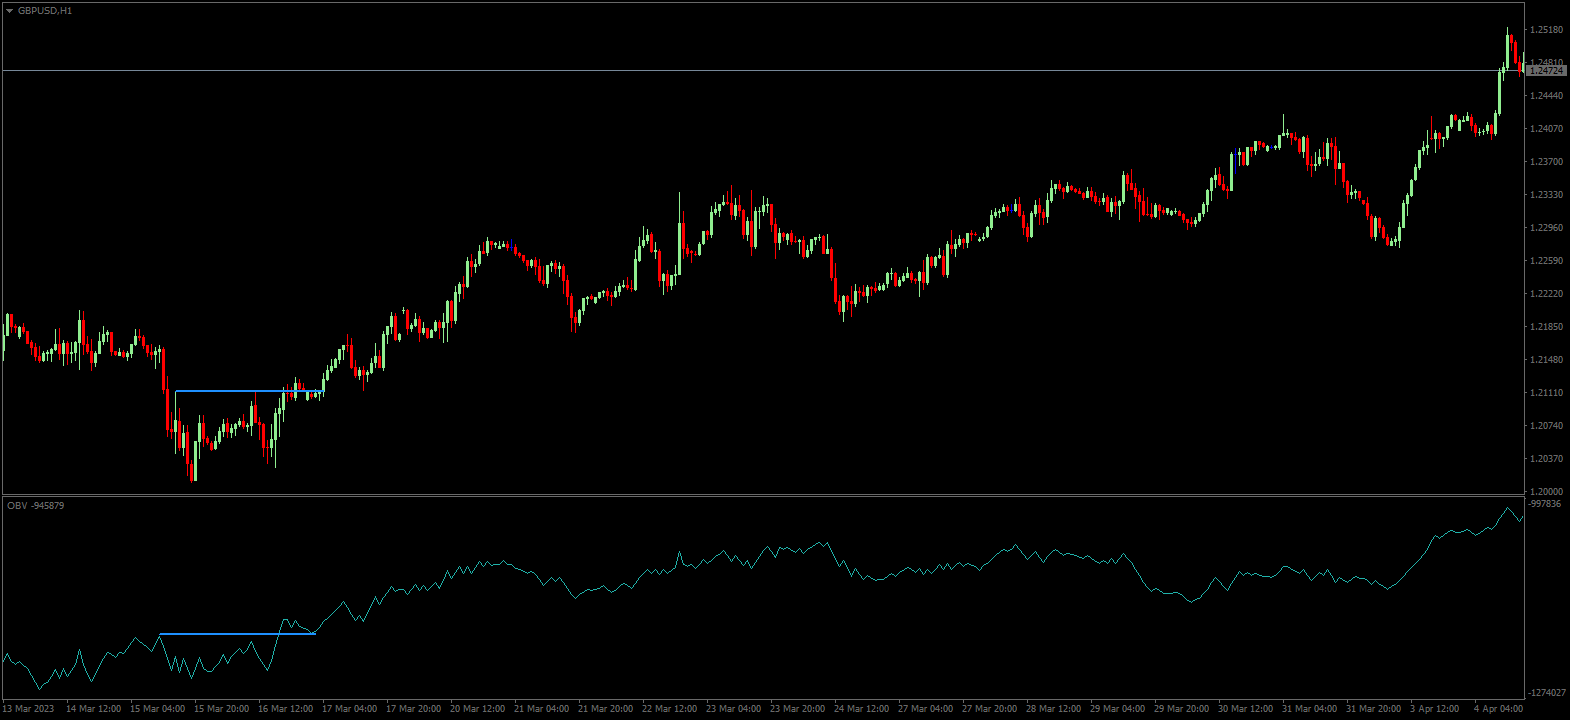
Breakout
Another way to use the On Balance Volume indicator to confirm price action is based on a breakout of support and resistance levels. In this case, the OBV indicator can act as a false breakout filter on price action. Therefore, when a support or resistance is broken on the price chart, OBV serves as a confirmation that an up/down trade volume is also occurring and the price could break an important level.
Disadvantages of OBV
The main disadvantage of the On Balance Volume indicator is the fact that significant short-term fluctuations in trading volumes can affect the value of the indicator for a longer period of time. This can happen, for example, during macroeconomic news announcements, or earnings announcements for stock companies.

Conclusion
As is the case with other indicators, On Balance Volume is not a self-sufficient and perfect solution that should work as the only solution for a trader to generate a signal to enter the market. To refine and fine-tune the signals, it is a good idea to combine it with other technical analysis tools such as trend lines, moving averages etc. At the same time, every trader should be aware that too many indicators can be rather counterproductive.


- As many Free Trials as you need
- Up to $200,000 account
- No time limit

Worldwide Reviews