Technical analysis - how to use Stochastic Oscillator
In the next part of our series on technical analysis and indicators, we will look at another momentum oscillator, which is known as the Stochastic Oscillator. This indicator measures the speed of movement and momentum of the price of an instrument while determining the trend and its changes.
The Stochastic Oscillator was developed in the 1950s by George Lane, who said that the change in momentum or speed of movement of the price of an instrument occurs before the price itself changes direction. George Lane said that the Stochastic Oscillator does not track the price itself, the volume, or anything like that, but it tracks just the speed or the momentum of the price (the strength of the trend). Stochastic in its basic form compares the specific closing price of an instrument in relation to the highest and lowest price over a period of time, usually 14 days (or other time units, depending on the timeframe of the chart the trader is using for trading).
What is a Stochastic Oscillator?
The idea of the indicator is based on the fact that in an uptrend the price of an instrument tends to close near the high and in a downtrend near the low. However, when prices close further away from the high or low, it means that the momentum is weakening and a change in trend may occur.
Similar to other oscillators (such as the RSI, we recently published an article about it), the Stochastic is displayed in a separate chart window and the ranges are between 0 and 100. Although at first glance the RSI and Stochastic are very similar, the main difference is that the RSI takes into account all closing prices in a given period, however, the Stochastic only considers the current price in relation to the highest and the lowest price.

Calculation
The Stochastic also displays two lines, however, unlike the RSI, one represents the value of the indicator itself (%K) and the other one represents its three-day moving average (%D). The formula for calculating the value of the indicator looks like this:
%K= 100[(C - L14) / H14 - L14)]
where:
C = the last closing price
L14 = the lowest low for the last 14 periods.
H14 = the highest high for the last 14 periods.
%D = a simple moving average with period 3.
The default values of the indicator are set with the deceleration or smoothing %K value being usually set to 3, which reduces the sensitivity to changes in the price of the instrument.
14 periods is considered to be a long enough period for the calculation, but at the same time not too long to react to changes. However, traders who trade on shorter timeframes can set a shorter period and the indicator will then generate more signals for entries.
Use of the indicator
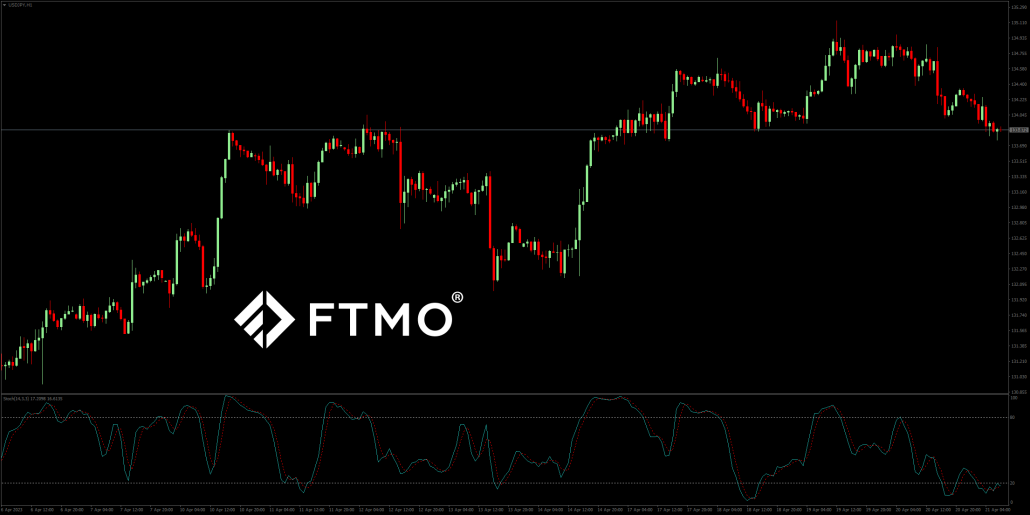
Similar to the RSI, the basic use of the Stochastic Oscillator is to indicate overbought or oversold conditions in the market, i.e. to suggest that an uptrend or a downtrend on the instrument is coming to an end. It indicates that overbought market conditions occur when the indicator goes above the 80-point level, with a return of the indicator value below the 80 level representing a sell signal. A signal for oversold conditions occurs when the indicator falls below the 20-points level and a buy signal occurs when the indicator returns above the 20-points level.
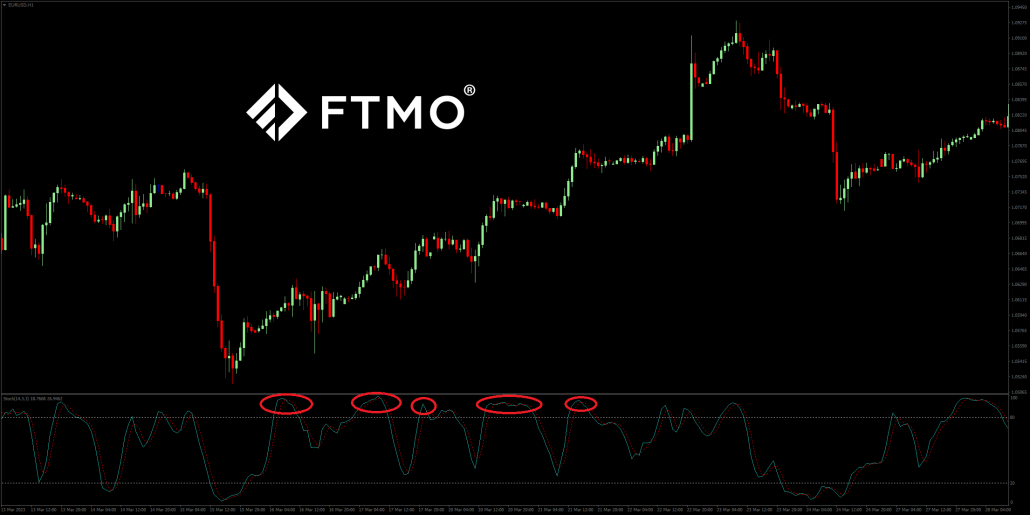
Similar to the RSI, the disadvantage of this indicator is that in stronger trends or in highly volatile markets the price may reach oversold or overbought levels very often and therefore generate false signals. The solution to this problem may be to move the levels to 15 and 85, but this may result in traders missing out on some great opportunities. Another solution would be to trade only those signals that are in the same direction as the current trend.

Divergence
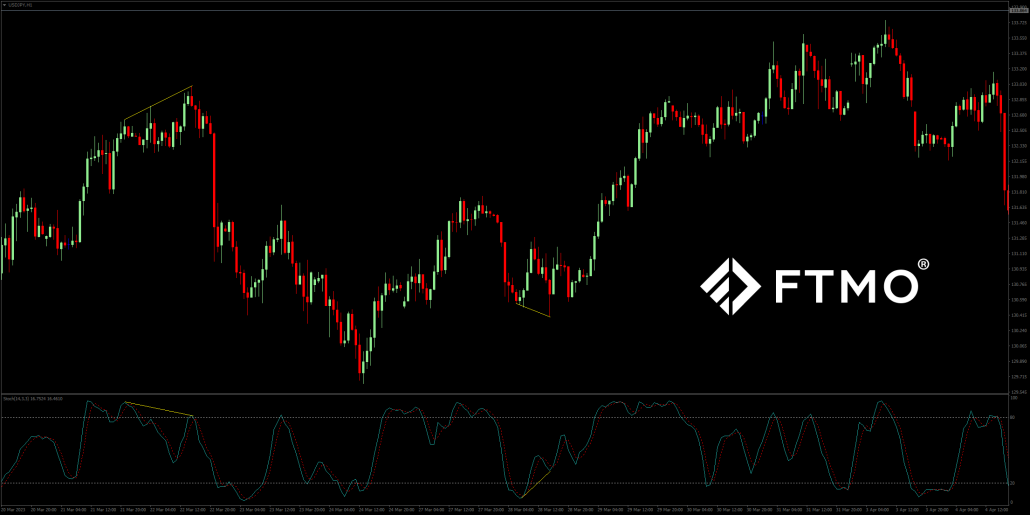
One popular way to use the Stochastic Oscillator (as with most oscillators) is called divergence. Again, a bullish divergence occurs when the price of the instrument makes lower lows while the Stochastic makes higher lows, so the downward move loses momentum and a reversal is possible. A bearish divergence appears when the price makes higher highs and the indicator makes lower highs, so the upward movement loses momentum and a trend reversal can be expected. However, for this to be a truly valid signal, it must be confirmed by an actual reversal in the price of the instrument itself.

Crossover
Crossover occurs when both indicator lines (%K and %D) cross above the oversold level or below the overbought level. A sell signal occurs when the %K line crosses the %D line downwards above the overbought level, a buy signal occurs when the %K line crosses the %D line upwards below the oversold level.
Other ways of use the indicator
In addition to the 20 and 80 lines, the 50-points level is also often used in the Stochastic Oscillator, which some traders use as a strong entry signal when this level is crossed. When the %K line crosses the 50-points level downwards, it is a strong sell signal, while when it crosses it upwards, it is a strong buy signal.
As with other technical analysis tools, Stochastic should not be used as the only tool for generating buy and sell signals. Combining it with other tools can clearly improve its success rate and provide the trader with much higher quality position entries. Stochastic can thus be used in combination with moving averages, trend lines, chart formations and other technical analysis tools.
About FTMO
FTMO developed a 2-step Evaluation Process to find trading talents. Upon successful completion you can get an FTMO Account with a balance of up to $200,000. How does it work?.


