


Volume Spread Analysis – Trading the VSA

In this article we will introduce the famous Volume Spread Analysis (VSA) system that uses the very foundation of market behaviour.
Volume Spread Analysis
The foundation for this system was laid by Richard Wyckoff, the legendary trader, who supposedly earned a fortune with this system. In the 1970s, this system was taken by Tom Williams, who developed it into its present form, popularize it and named the system Volume Spread Analysis. According to the author, this system applies to all time frames and all markets, where we have high quality data feeds.
Before we discuss the individual entry patterns, let’s first consider whether we can use this system on a decentralized forex markets, where the traded volume is inaccurate. Below is a comparison between the futures exchange platform, which shows the exact data directly from the exchange and the MetaTrader 4 platform with inaccurate data.
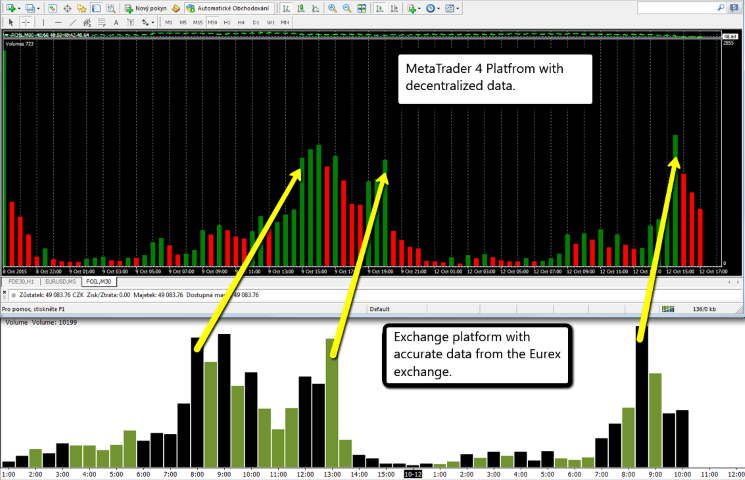
It can be seen from the picture that the volume is proportionally the same. It can be assumed that we can apply this system also for forex markets.
The basic premise of the system is:
VSA looks for the cause of the price change in the imbalance between supply and demand caused by Smart Money.
VSA has these variables:
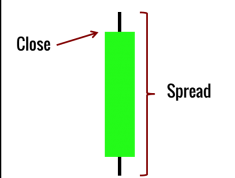
Spread of an candle
- Volume – shows activity.
- Spread – shows the size of the market movement.
- Closing price.
- Weak Money – Unprofessional fearful traders.
- Smart Money – Professional traders and institutions.
VSA is working on the assumption that the market is constantly in one of four phases:
- Accumulation
- Mark up
- Distribution
- Mark down
Of course, it depends on the time frame a trader trades. In the case a trader is trading intraday, the market might be in a different stage than is the current long-term market phase.
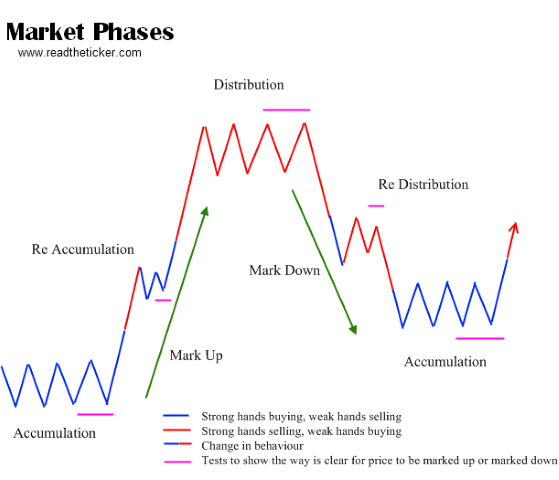
Market phases
Accumulation
Is the process in which Smart Money buys a large quantity of assets at a price they think is advantageous. Accumulation occurs in congestion areas and the total volume of trades is low, because accumulation takes some time. Congestion area is a sideways area without any trend. Other signes of the accumulation phase:
- Total volume should be very low. In the event of a higher volume, the spread of the day (or other timeframe, such as a spread of a five minute candle) should remain low.
- Candle spreads should be narrow.
- Traded volumes should be higher at the top of the congestion area and lower at the bottom of the congestion area.
- Accumulation takes a very long time from the point of view of the timeframe.
It is important to remember that the market context is always superior and it is likely that the above conditions will never be met. The entire accumulation process culminates in the next phase called Mark up.
Mark up
Once Smart Money has accumulated enough assets, the Mark up phase comes in, when the top of the accumulation area breaks. Mark up is characterized by the fact that candles form higher lows and close near the top. The volume traded is not high because no one is resisting buyers. Short corrections are on a low volume. If a traded volume was high, it would also mean that sellers are entering the market, which would not be good for buyers. Short correction serves as a place to close profits. Low of every short correction should be higher than the low of the previous correction. The end of the Mark up phase could by indicated by smaller up candles with very low volume. The Mark up usually end with a Buying Climax – huge up candle, which is caused by Weak money entering the market.
Distribution
After Buying Climax, Smart money starts to sell their positions without lowering the price because Weak money is entering the market. A nice example of a distribution is not easy to find, concentrated areas, where Smart money sells positions to Weak money is rarely found.
Mark down
Once Smart money gets rid of its positions, then it is the time for Mark down. Mark down is the most dramatic market phase full of panic. For Mark down are typical wide short candles. The end of the Mark down phase can be noticed through price patterns such as Stopping Volume or Absorbtion Volume.


- As many Free Trials as you need
- Up to $200,000 account
- No time limit

Worldwide Reviews