Market Profile, Volume Profile and Auction Market Theory
Auction Market Theory tries to breakdown the main purpose of the market and how the market participant interacts to fulfil this purpose. The only purpose of the market is to facilitate trade through what is known as dual auction process.
One of the thing what traders often say and it's completely wrong when the market go fast one direction is it happened because there were more buyers versus sellers. This is not true since for every buyer there has to be a seller and vice verse.
When the price is going up or down, there is no supremacy on either side, but the amount of aggressivity or willingness to buy/sell for higher/lower prices.

In other words, the market is always seeking value based on supply and demand dynamics. This doesn't count only in trading financial markets but with other markets as well.
Using this logic, stock prices are easy to see an example.
Let's say that right now Apple stock is trading at $100.
New iPhone comes out and it is disaster, the battery is not working, it keeps shutting off etc.
Because of this event, Apple stock starts to dropping on its value until it finds new buyers at lest say $80 per share price.
This is where is the new value area created.
Sometimes pass, iPhones get repaired which means that buyers start to step back in the market.
Where is the market likely to stop? Previous value area around $100.

This is eventually what every market does as Market participants negotiate prices between balanced and imbalanced values.
Auction Market Theory defines an area where 68% of the volume has traded as a Value Area.
There are 3 key components of Auction Market Theory:
Price – Advertise opportunity in the market
Time – Regulate price opportunity
Volume – Measure the success or failure of the auction. Volume is variable and represents the interaction of market participants at different levels.
To sum the Auction Theory up you always have to understand the context of a given market.
Is the price in balance or imbalanced?
The general rule of thumb is once the market is inside the value it will more likely stay in balance and explore inside the range of the value.
But if the market is an imbalance, it will often drift higher/lower until it stops which is usually inside a previous value area.

Introduction to Market Profile
Concept of Market Profile was created at Chicago Board of Trade (CBOT) by trader Peter Steidlmayer and first published during the 1980s as CBOT product.
Market profile by itself is not a stand-alone strategy, but a different way how you can view the market and make better trading decisions.
They have seen a market as an auction process which is affected by supply and demand the same way as every other auction, for example, development of prices of food, gas etc.
The price goes up as long there are buyers in the market who are willing to buy at higher prices. The price goes up until there is at least one buyer who is willing to buy at a particular price level.
The opposite scenario is happening when the price is going down, the market is trying to lure in sellers willing to sell at lower price levels which are attractive for buyers.
With this simplified description, it is important to realize that in each transaction, there has to be one trader buying and one selling at the same time for the market to move.
When the price is going up or down, there is no supremacy on either side, but the amount of aggressivity or willingness to buy/sell for higher/lower prices.
The next factor which creators of Market Profile consider is the fact that the market is lead by repeating patterns in the behaviour of market participants, which are the same at all different markets such as stocks, futures or forex.
This means that Market Profile is applicable to every market of your choice.
Because of that, Market Profile doesn't have strict rules. We are looking at Market profile as the principal approach and it is up to every trader on how he/she is going to use this technique.
Since the first release in the 1980s, the Market Profile evolved itself in a way to be able to react to changes in the trading environment.
The ongoing globalization and electronization in the markets caused the lower impact of pit trading sessions as major factors of profile distribution, and the reason behind that is the fact that people can trade from anywhere in the world at any time of the day.
Market Profile - Graphic Representation
Market Profile arranges separate trading sessions to the so-called profiles, instead of classical charts representations.
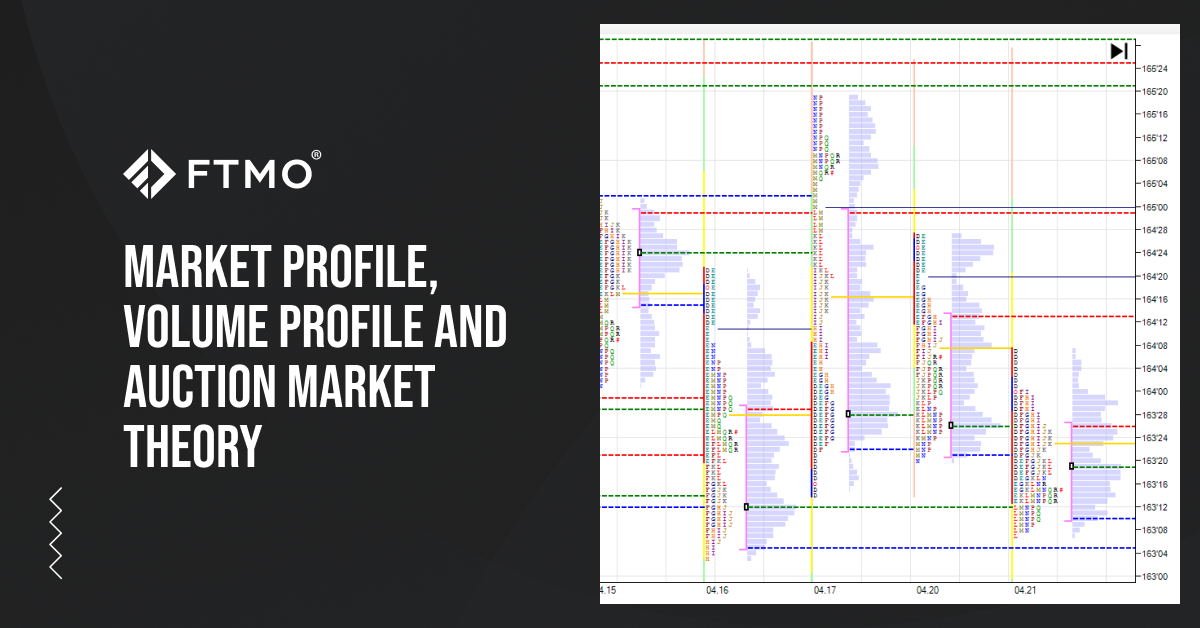
The picture below shows an example of how the screen of Market Profile trader can look like.

Y-axis represents a price while X-axis represents time.
This is something which we can also see on our candlesticks charts, but on Market Profile, time is represented in the form of separate distribution, in this case, sessions by regular trading hours of the product.
Representation of each session is made from TPO (Time Price Opportunity) on the left side and VPO (Volume Price Opportunity) on the right side.
What we can see is a three-dimensional chart displayed on two-dimensional space.
Let's discuss TPO first.
TPO (Time Price Opportunity - Market Profile)
In one trading session, the time is not separated by the position of elements, but only with a typographical separation for different trading periods.
Principle of TPO can be represented with this picture.
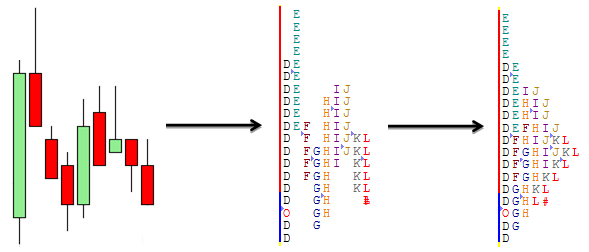
On the left picture is a typical 30-minute timeframe chart. Individual candles are replaced by letters of the English alphabet, in the above example - starting with a letter D (picture in the middle). Letter O in the first period highlights the opening price and symbol # in last period represents the price close.
At the end of each session, all the letters will line up the way there is no space left between them.
This way, the Market Profile (last picture on the right) is finished.
From the TPO profile, we calculate POC (point of control) - line with the most amount of numbers and VA (value area) - 70% of letters around POC.
These calculations are also used in the VPO where most traders believe that they will find more accurate level based on volume, instead of time as it is with TPO.
VPO (Volume Price Opportunity - Volume Profile)
Contrary to any traditional volume indicator, we can find VPO on the Y-axis on our chart.
The volume is displayed and calculated separately at each price level, and this gives us the opportunity to determine a fair value more precisely.

The Profile Glossary

Market Participants and Their Motivation
Creator of Market Profile, Peter Steidlmayer, started dividing market participants into two major groups.
Each group has different motivation and trade on a different timeframe and with different sizes.
Short-term Time Frame traders - STF
Traders who trade on low timeframes, Steidlmayer categorized as small, mostly retail traders, who want to trade on an intra-day basis.
They don't have enough time to wait for favourable prices and trade between each other around the fair value which is represented with Point of Control and which both sides consider to be fair enough for buying and selling.
They generally don't have enough capital to be able to move the market.
For setting up the Initial Balance (IB), Steidlmayer uses the first trading hour after the market opens.
We use the first trading hour of the trading day (IB) as our reference point.
Long-term Time Frame traders - LTF
LTF traders who can also be called Other Time Frame (OTF) traders usually open their position for several days, weeks, months or years.
They can afford to wait longer for the price level which they consider favourable.
Usually, these traders are called Smart Money - banks, hedge funds and institution which have much higher capital compared to retail traders.
Because of that, they can open big positions which can influence the price and create a long term momentum in the market.
Most of the times, they can't even open the number of contracts at one price so they have to build their positions slowly up, and in most of the times, this takes several days and causing the market to trend.
Market Profile - Distribution Types
To be able to trade Market Profiles effectively, we have to separate individual trading days into categories based on the initial balance of the session.
Analysis of Initial balance for each day can help the trader to make decisions during later trading hours.
The initial balance is mostly used in futures trading as Forex is a 24hour market, but it is still part and parcel of Market Profile trading so every trader who wants to master the concept should know this.
Samples you are going to see are going to be represented with both Market and Volume Profiles next to each other. The IB is marked with a black line on VPO and blue-red vertical line in case of TPO profile.
Normal Day
Name of this day can be misleading since it's very rare to see this in day-to-day trading.
This day is typical by IB being wider than usual and not broken through during the whole day.
Thanks to that, we can say that OTF entered the market in the first hour and they don't participate anymore.
Short Term Traders and scalpers are very active, but they don't have enough force to move the market.

A normal variant of Normal Day
This is the most typical type of distribution. It is characterized by IB with normal size being broken only with one direction.
Breaking IB only to one side means that OTF entered the market and trying to move the price outside of IB.

Trending Day
Characteristics of this day are that OTF control the market from open to close.
Trending day happens when IB is broken at least 2 times from normal IB.
This is created when the fair value of the market changes.
Because of the sharp moves, market leaves areas of low volume nodes, which tend to be tested in the upcoming days.

Double Distribution
Double distribution is shown by a quick change of a value area during a day, and this is often happening during the high impact news.
A quick move of value will cause the end of one distribution, break through the initial balance and make a new distribution at the opposite side of the profile.
What we can see at the end of the day are two balanced distributions with significant Low volume node areas.
Neutral Day
Similar to Normal day, we have an extended initial balance.
If the price is breaking above IB high, this will quickly attract sellers who are likely to bring the price back to Point of control or the IB low.
Once sellers break below IB low, the price quickly reverses and the market will eventually close inside the IB range.

Neutral Day - extreme
On such a day, IB is also broken out to both sides, but the market will close outside of IB range at the end of the day.
This means that one side of OTF was more aggressive.

Non-Trending Day
Represented with very tight IB.
We can experience non-trending days during holidays or wait before high impact news.

Opening Types
With Market Profile trading, we define four types of opening types by looking at the previous day.
Being able to identify the early opening type will help the trader set the bias for the day.
Open-Drive (OD)
Open-drive is seen when the price will start running one way immediately after the market open.
In these cases, the opening price can be the high or low of the day.
This type of open is giving us a signal that it is not clever to counter-trade the trend and it is way smarter to wait for pullbacks and trade with this trend.
Open-Drive is giving us a strong conviction that the fair value of the price is changing rapidly and we are entering into a trending market.

Open-test-drive (OTD)
Open-test-drive is a more usual type of open when the market is on its way to test a significant level from the previous day.
We are watching the reaction from previous day POC, Value Area Low and Value Area High.

Open-rejection-reverse (ORR)
Similar to OTD, we can see an opening in one direction, but sharp rejection from one point.
Difference between OTD and ORR is the fact that ORR is usually aiming for some higher timeframe levels with a lot of liquidity.

Open-Auction
Open-Auction signalizes a balance between buyers and sellers.
In this situation, market participants agreed on a fair value for a whole trading day and the price is usually bouncing inside the previous day Value Area.

Volume in Forex
Information about the real volume is available at different exchanges and it's not for free.
A lot of traders will argue that there is no volume in Forex since you are in the OTC (Over the counter) market which doesn't have a central exchange and there is no standardization in volume and expiration.
This is true but once you will display Volume for any CFD, you will see this derived on the x-axis as a volume pop up. Now, let's compare it with the real volume.

The chart above shows CFD for Crude Oil on the MT4 platform, from 1st of November 2013 till 13th of August 2015. The histogram shows price changes in daily periods.

In the chart above, you can see the futures Crude Oil chart at CME exchange from 22nd of October 2013 till 13th of August 2015.
The histogram shows the value of real traded contracts during market trading hours.
Let's compare those two histograms side by side.

The volumes marked with checkmarks are more or less the same. On the other hand, volumes marked with question marks are significantly different.
From the above example, we can see that we are not looking at a perfect correlation, but volumes are more so the same.
Futures volumes are more detailed, but there is no reason to be turned off from volume when you are trading CFD contracts.
Market Profile indicators for MetaTrader4
These indicators are not made by FTMO team and we are not responsible for possible trading mistakes. Also, these indicators can slow your trading platform so we don't recommend to use them in times of execution.
+TPO
You can easily set up the data you want to analyze.
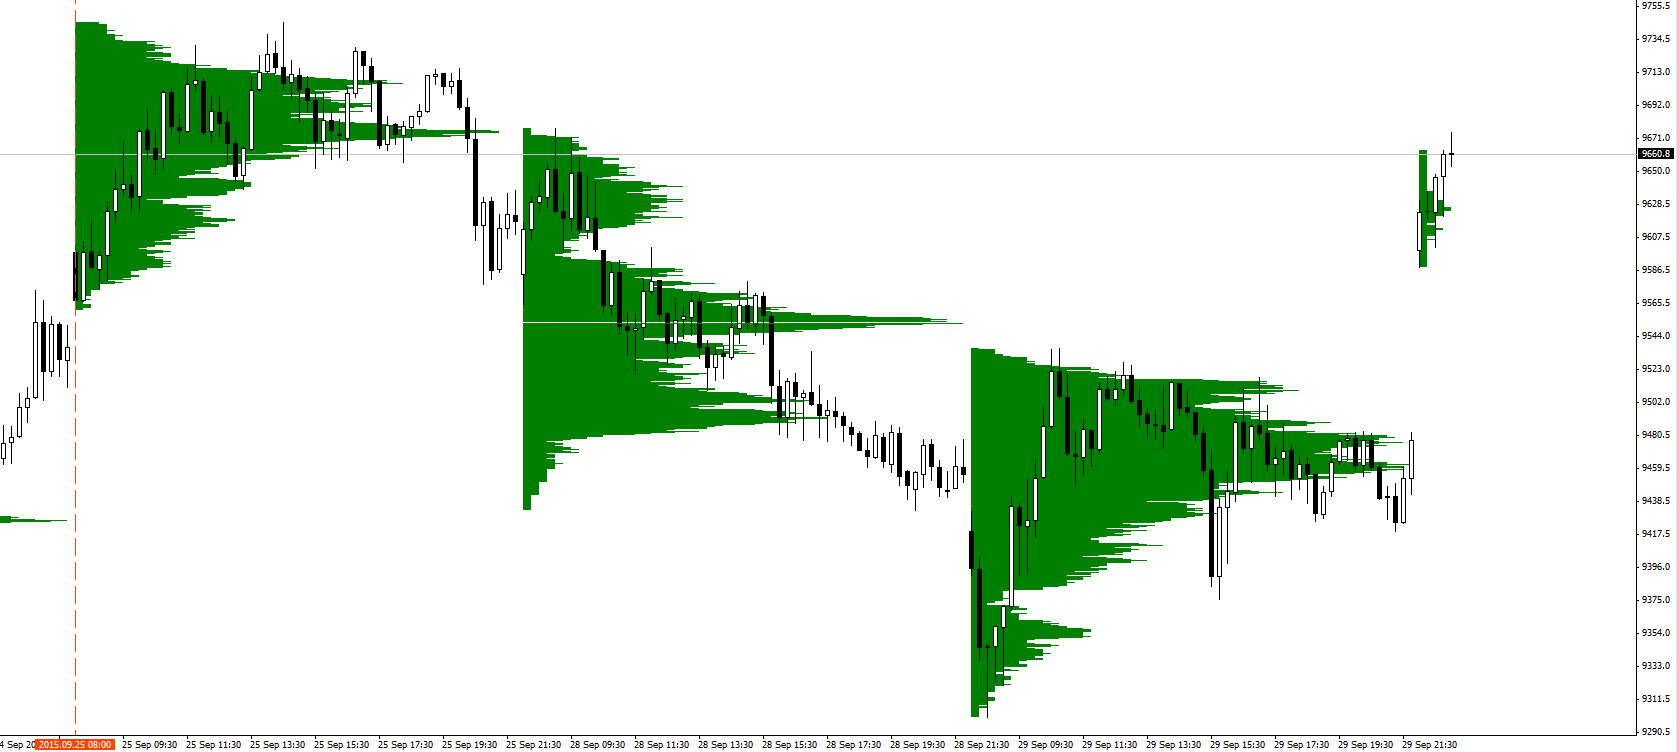
ay-MarketProfileDWM
Shows profile for each trading day with value area.

Market Statistics
This indicator is built by time and Price Action instead of real volume.

TPO-Range
You can easily set up the range you want to analyze

Market Profile in Forex trading
We will conclude this article with a few live examples from the foreign exchange market, just to demonstrate how beneficial Market Profile can be in your day to day trading.


This article is for informational purposes only, and some information may not reflect the current service offering or product features. Please always verify the latest terms on the official product pages.
About FTMO
FTMO has developed a two-step evaluation process to find trading talents. Upon successful completion, you may be eligible for an FTMO Rewards Account with a balance of up to $200,000 in simulated funds. How does it work?


