Trading Week Ahead: Will CPI Fuel or Crush the Rally?

US equity futures face renewed turbulence as Middle East strikes trigger a 5% oil spike and tech stocks stumble ahead of a high-stakes Q2 earnings season. Big banks kick off reports this week, but traders are focused on whether AI infrastructure giants can deliver the massive margin expansions needed to justify lofty valuations.
With energy-driven inflation fears resurfacing and Federal Reserve policy remaining strictly data-dependent, the upcoming US CPI, PPI, and retail sales prints guarantee a highly volatile week.
Brace for this week’s three key economic events:
👉 US CPI – 14:30, Tuesday (CEST)
The macroeconomic event of the week (forecast: -0.1%, prev.: 0.5%). A sharp month-on-month drop will soothe inflation fears, while an upside surprise combined with surging oil will heavily rattle risk assets.
👉 US PPI – 14:30, Wednesday (CEST)
A vital secondary inflation read (forecast -0.1%, prev. 1.1%). This will confirm the broader wholesale inflation trend or spark sudden US dollar volatility if it diverges from the CPI print.
👉 US Retail Sales – 14:30, Thursday (CEST)
A key gauge of consumer spending (forecast 0.3%, prev. 0.9%). A downside miss here signals economic cooling and will likely drag down government bond yields.


| Date | Time | Instrument | Event |
|---|---|---|---|
| 14/07/26 |
14:30
|
USD
|
CPI |
| 15/07/26 |
14:30
|
USD
|
PPI |
|
15:45
|
CAD
|
BoC Interest Rate Decision | |
| 16/07/26 |
08:00
|
GBP
|
GDP |
|
14:30
|
USD
|
Retail Sales | |
| 17/07/26 |
11:00
|
EUR
|
CPI |
|
16:00
|
USD
|
Prelim UoM Consumer Sentiment | |
|
USD
|
Prelim UoM Inflation Expectations |
*All times in the table are in CEST
Technical Analysis with FVG Strategy
This technical analysis uses the EMA 20 and EMA 50 to determine market trends, alongside volume analysis (VPOC) and the Fair Value Gap (FVG), which refers to price imbalances caused by aggressive movements, signalling key entry and exit points. This strategy applies to EURUSD, GBPJPY, US100, and XAUUSD, providing insights into both last week’s market opportunities and the current ones.
Opportunities to Watch This Week
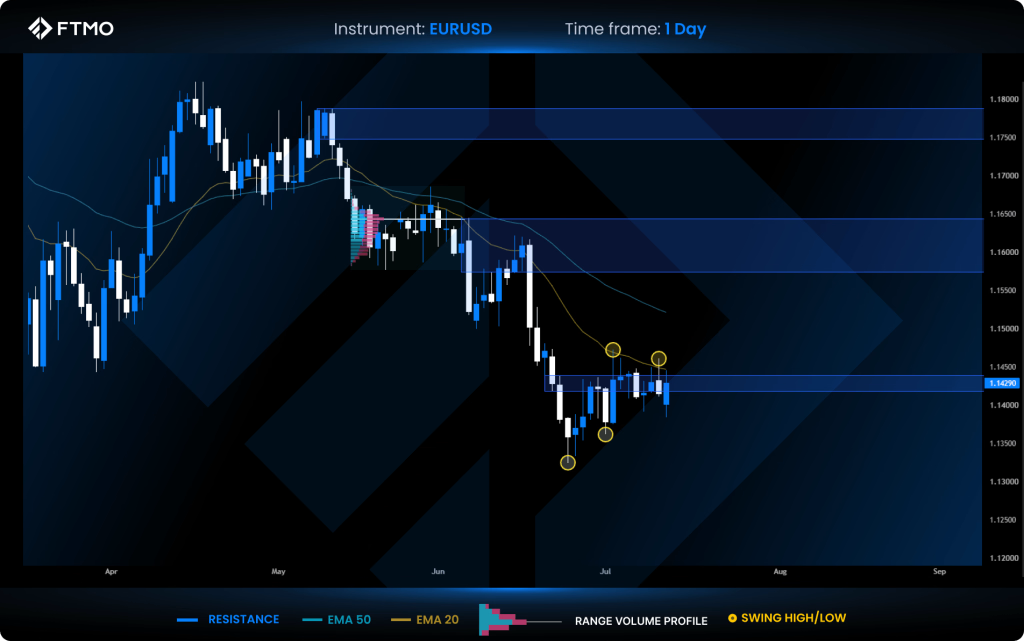
EURUSD
Market Context: The price continues to hold below resistance, and the 20 EMA still indicates a bearish trend. This downward pressure is further confirmed by Friday’s smash bar and today’s negative open.
Bearish Scenario (Preferred): The preferred scenario is a downward continuation to sweep the marked sell-side liquidity below.
Bullish Scenario (Alternative): A decisive daily close above resistance. This would sweep the overhead swing highs and potentially pave the way for a continued upward move.
FVG Setup: No FVG setup formed this week as the market remains bound in a tight range, likely consolidating ahead of potentially aggressive moves driven by the upcoming CPI and PPI data releases.
GBPJPY
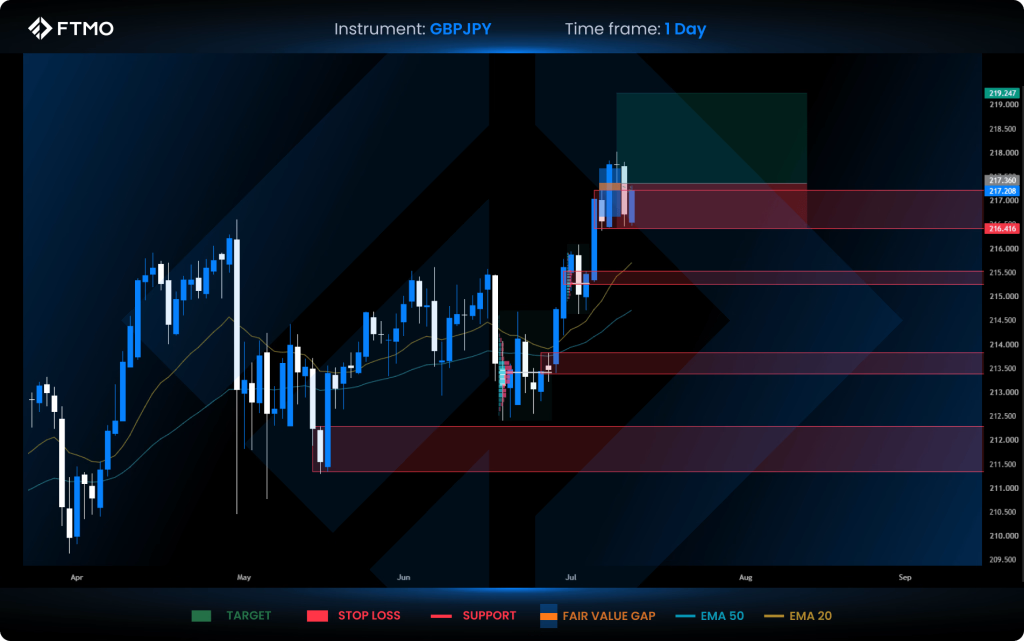
Market Context: The market remains in a strong bullish trend, consistently respecting structural supports. On Friday, the price dropped into a support zone, where it is currently showing a positive reaction.
Bullish Scenario (Preferred): The preferred scenario is a direct continuation of the overarching bullish trend.
Bearish Scenario (Alternative): A daily close below the current support zone. This would signal further downward momentum and a potential drop into the next lower support tier.
FVG Setup: A bullish FVG formed last Thursday and remains active and in play.
XAUUSD
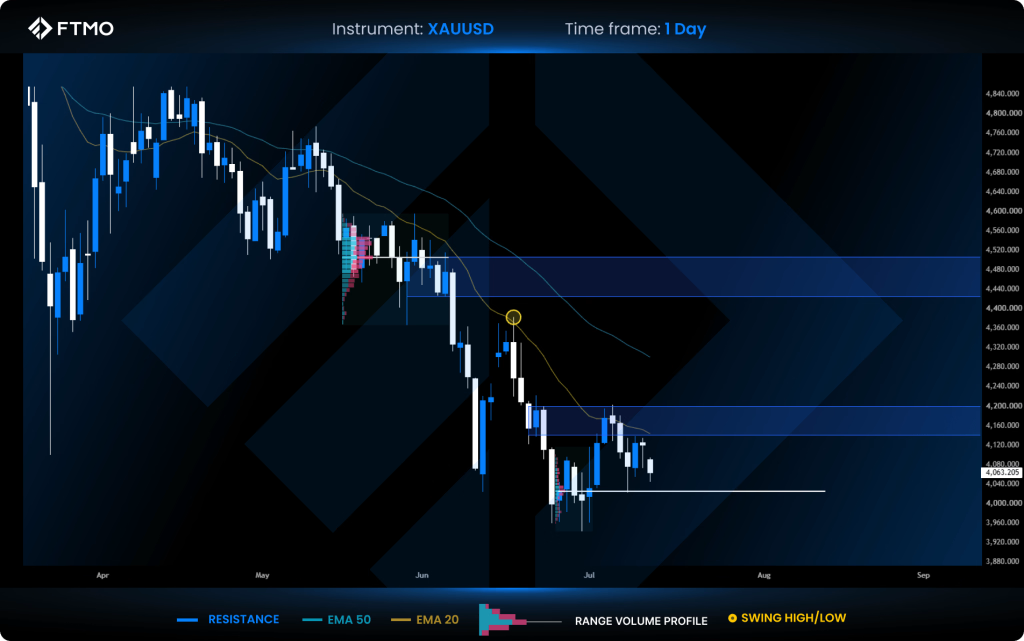
Market Context: Following a reaction at overhead resistance, gold dropped into the VPOC range, where buyers successfully defended the level. The asset is currently consolidating without significant directional movement but remains below the 20 EMA, indicating a broader bearish trend in both the short and long term.
Bearish Scenario (Preferred): The preferred scenario is a short continuation back down to test the VPOC range. If the price breaks below this level, a further drop to sweep the marked liquidity pool is expected.
Bullish Scenario (Alternative): A daily close above the overhead resistance zone. This would signal a clear market structure shift to bullish.
FVG Setup: No FVG setup formed this week or last week due to a lack of sufficient market volatility.
US100
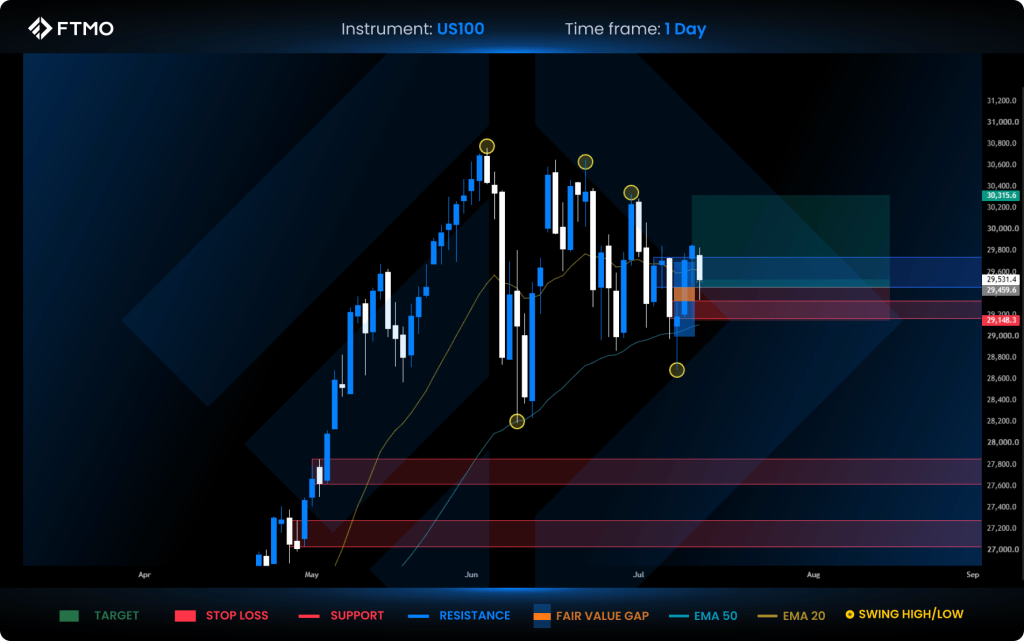
Market Context: The index remains within a daily range, but following last week’s liquidity sweep, the price successfully closed above resistance and printed a clean bullish FVG.
Bullish Scenario (Preferred): The preferred scenario is a bullish upward move targeting the nearest marked swing high, aligning with the active FVG to offer a potential 2.75:1 RRR.
Bearish Scenario (Alternative): A daily close below the underlying support. This would invalidate the active FVG setup and signal a potential drop lower toward the recent swing lows.
FVG Setup: A long FVG has materialised and is valid for execution. The setup targets the marked overhead swing high, yielding a potential 2.75:1 RRR.
All information provided herein is intended solely for educational purposes related to trading on financial markets and does not constitute investment advice or serve in any way as a specific investment recommendation. Please read the full disclosure here.


Related






- As many Free Trials as you need
- Up to $200,000 account
- No time limit

- Unlimited Evaluation Accounts
- Trade with up to 3 Sim-Funded accounts
- Up to $450,000 in simulated capital
- Keep up to 90% of your simulated profits


Worldwide Reviews