


Trading Week Ahead: Nvidia’s Earnings

US stocks face renewed pressure as surging bond yields and $110 oil weigh on sentiment. Inflation fears are pushing borrowing costs to multi-month highs, compounded by weak economic data from China. Despite these headwinds, the AI-driven market rally holds strong but faces its ultimate test this week with Nvidia’s highly anticipated earnings.
Brace for this week’s three key economic events:
👉 EUR CPI MoM – 11:00, Wednesday (CEST)
The flash estimate for April confirmed annual inflation at 3.0%, driven largely by energy inflation, which jumped by nearly 11%. The final data will be a crucial input for the ECB ahead of its June meeting, where markets are now pricing in rate hikes rather than cuts.
👉 US FOMC Meeting Minutes – 20:00, Wednesday (CEST)
The minutes from the Fed’s April meeting will reveal the extent of the FOMC’s division in holding rates at 3.50 to 3.75%. Since April, hotter inflation data have wiped out expectations for rate cuts, and investors will be looking for signs of whether the Fed views inflation as a temporary shock or a structural problem.
👉 US Flash PMI – 15:45, Thursday (CEST)
A quick look at the state of the US economy in May forecasts a slight slowdown in manufacturing to 53.6 and stability in services at 51.1. Markets will closely monitor the report’s pricing components, as any sign of accelerating input costs would provide a further argument for a tighter Fed policy.
01:50

JPY
GDP
08:00

GBP
Claimant Count Change
14:30

CAD
CPI
08:00
GBP
CPI
11:00

EUR
CPI
20:00

USD
FOMC Meeting Minutes
10:30
GBP
Flash Manufacturing PMI
10:30
GBP
Flash Services PMI
14:30
USD
Philadelphia Fed Manufacturing Index
15:45
USD
Flash Manufacturing PMI
15:45
USD
Flash Services PMI
08:00
EUR
German GDP
08:00
GBP
Retail Sales
14:30
CAD
Retail Sales
| Date | Time | Instrument | Event |
|---|---|---|---|
| 19/05/26 |
01:50 |
JPY
|
GDP |
|
08:00 |
GBP
|
Claimant Count Change | |
|
14:30 |
CAD
|
CPI | |
| 20/05/26 |
08:00 |
GBP
|
CPI |
|
11:00 |
EUR
|
CPI | |
|
20:00 |
USD
|
FOMC Meeting Minutes | |
| 21/05/26 |
10:30 |
GBP
|
Flash Manufacturing PMI |
|
GBP
|
Flash Services PMI | ||
|
14:30 |
USD
|
Philadelphia Fed Manufacturing Index | |
|
15:45 |
USD
|
Flash Manufacturing PMI | |
|
USD
|
Flash Services PMI | ||
| 22/05/26 |
08:00 |
EUR
|
German GDP |
|
GBP
|
Retail Sales | ||
|
14:30 |
CAD
|
Retail Sales |
*All times in the table are in CEST
Technical Analysis with FVG Strategy
This technical analysis uses the EMA 20 and EMA 50 to determine market trends, alongside the Fair Value Gap (FVG), which refers to price imbalances caused by aggressive movements, signalling key entry and exit points. This strategy applies to BTCUSD, EURUSD, GBPJPY, US100, and XAUUSD, providing insights into both last week’s market opportunities and the current one.
Opportunities to Watch This Week
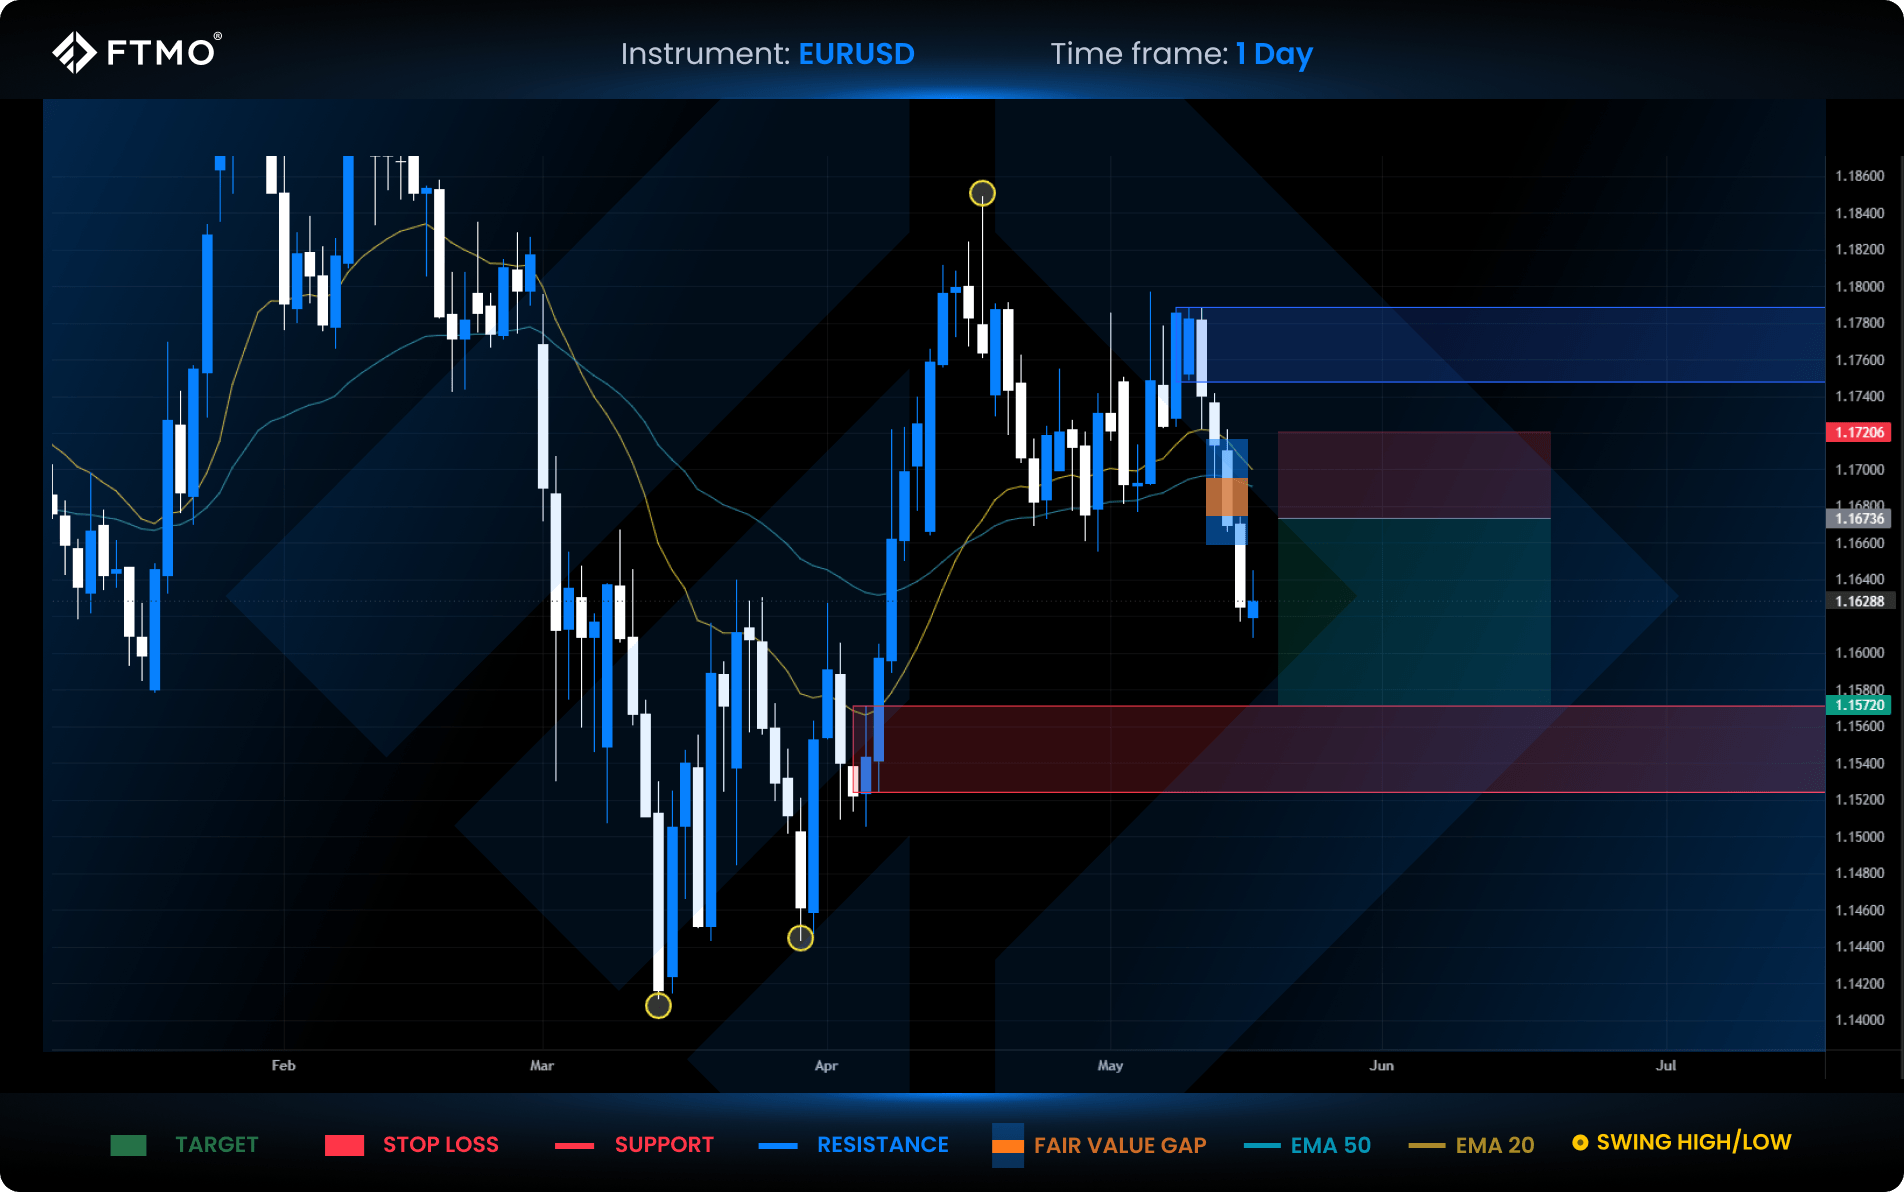
EURUSD
Market Context: The Euro began to weaken significantly, dropping below both the 20 and 50 EMAs and closing beneath the first support level. This price action has successfully shifted the market structure to bearish.
Bearish Scenario (Preferred): The preferred scenario is a continuation of the downward move toward the lower support zone, where a reaction from buyers could potentially occur.
Bullish Scenario (Alternative): A corrective pullback into the immediate resistance level. However, sellers are anticipated to regain control within this supply zone and drive the price lower once again.
FVG Setup: A bearish FVG has materialised and is valid for execution, offering a potential target at the lower support zone with a 2:1 RRR. Note that this setup becomes invalid if the price reaches the support zone without testing the FVG first, or if a new FVG forms along the way.
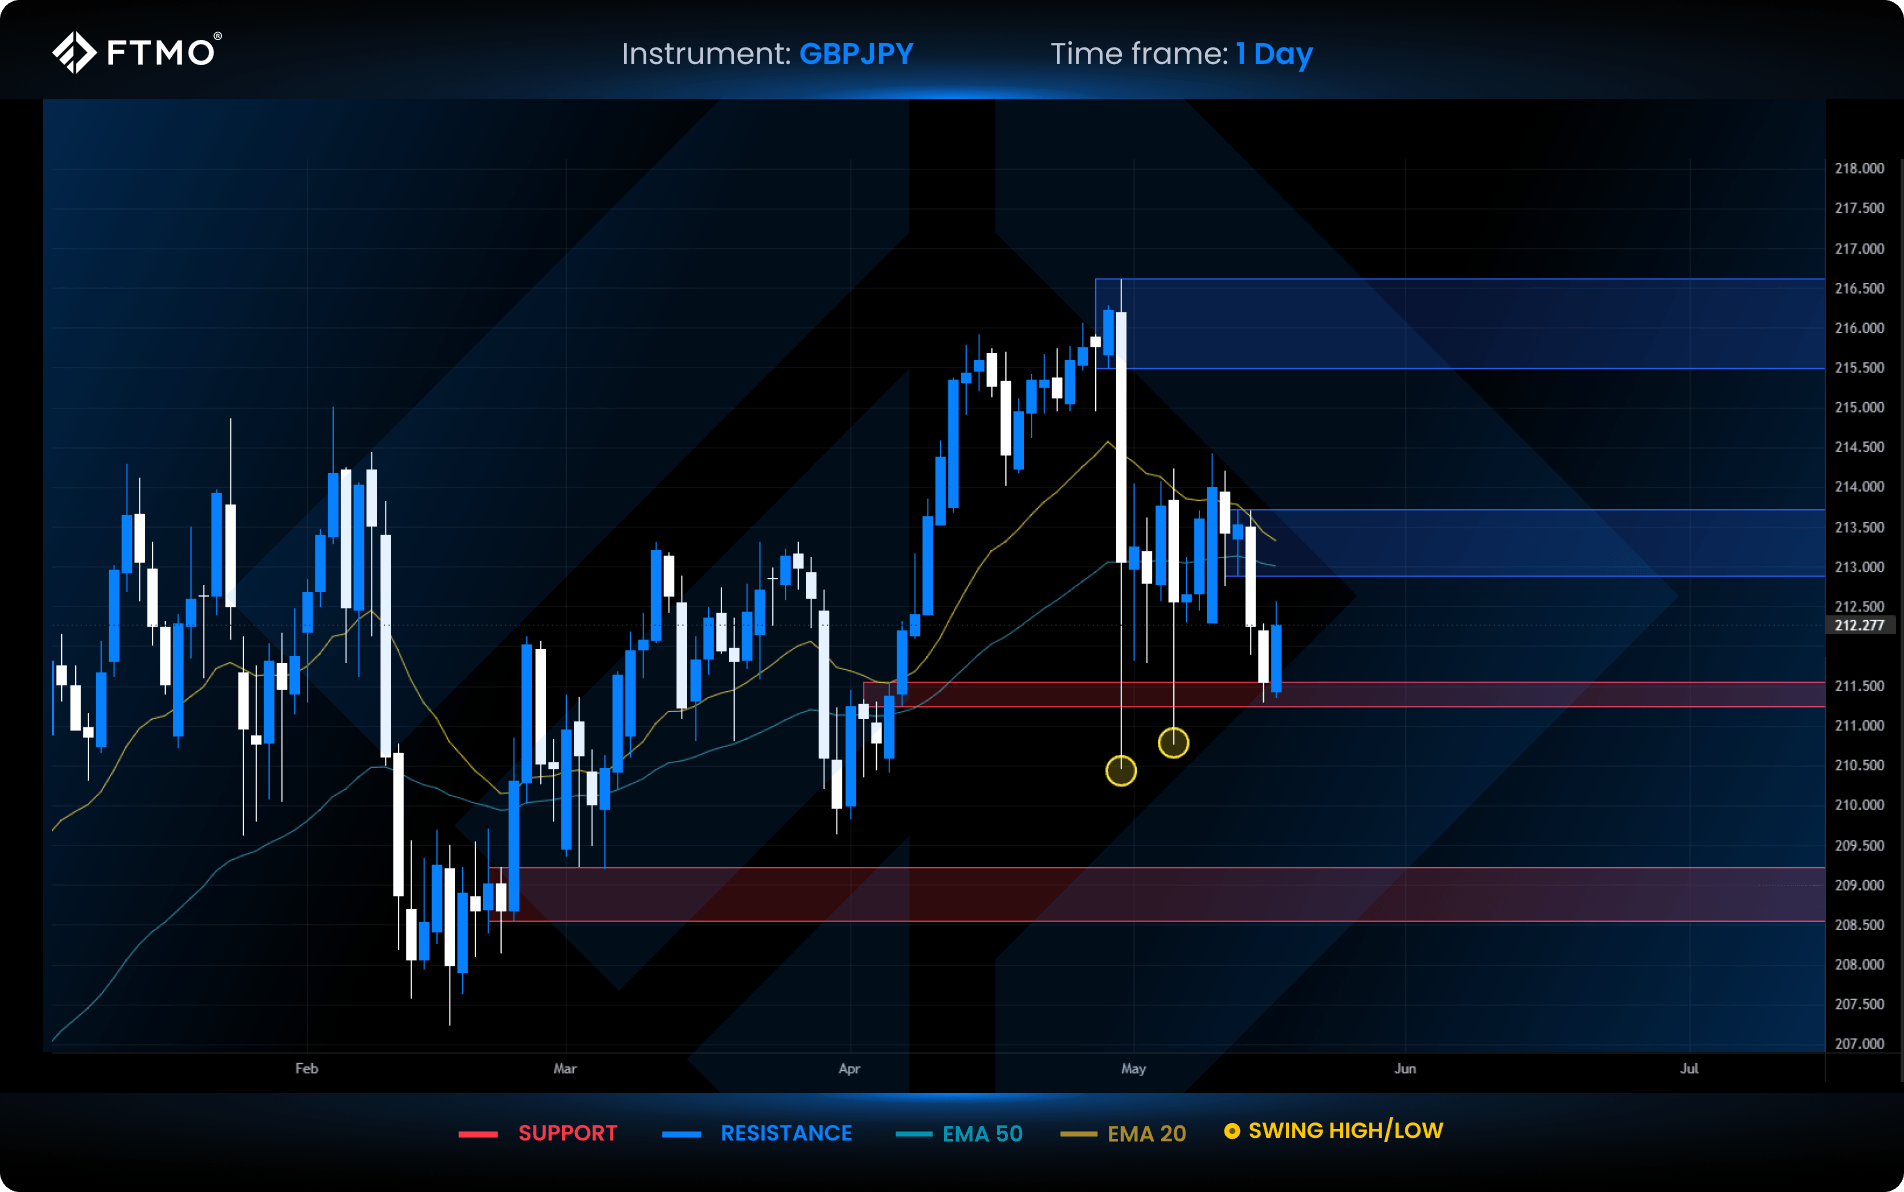
GBPJPY
Market Context: The price held the lower boundary of the FVG from the previous sharp sell-off and broke lower into a support level, where it is currently showing a positive reaction. However, this downward expansion printed a new bearish FVG, leaning the overall bias toward the sellers.
Bearish Scenario (Preferred): The preferred approach is to wait for a definitive daily close below the current support level. This would completely confirm a bearish market structure shift and signal a further decline into the lower liquidity pools.
Bullish Scenario (Alternative): A daily close above the immediate resistance level. This move would invalidate the active bearish FVG and provide a clear signal that the market structure has shifted back to bullish.
FVG Setup: A bearish FVG formed and has already been tested. It is recommended to wait for a confirmed daily close below the underlying support to fully validate further bearish execution.
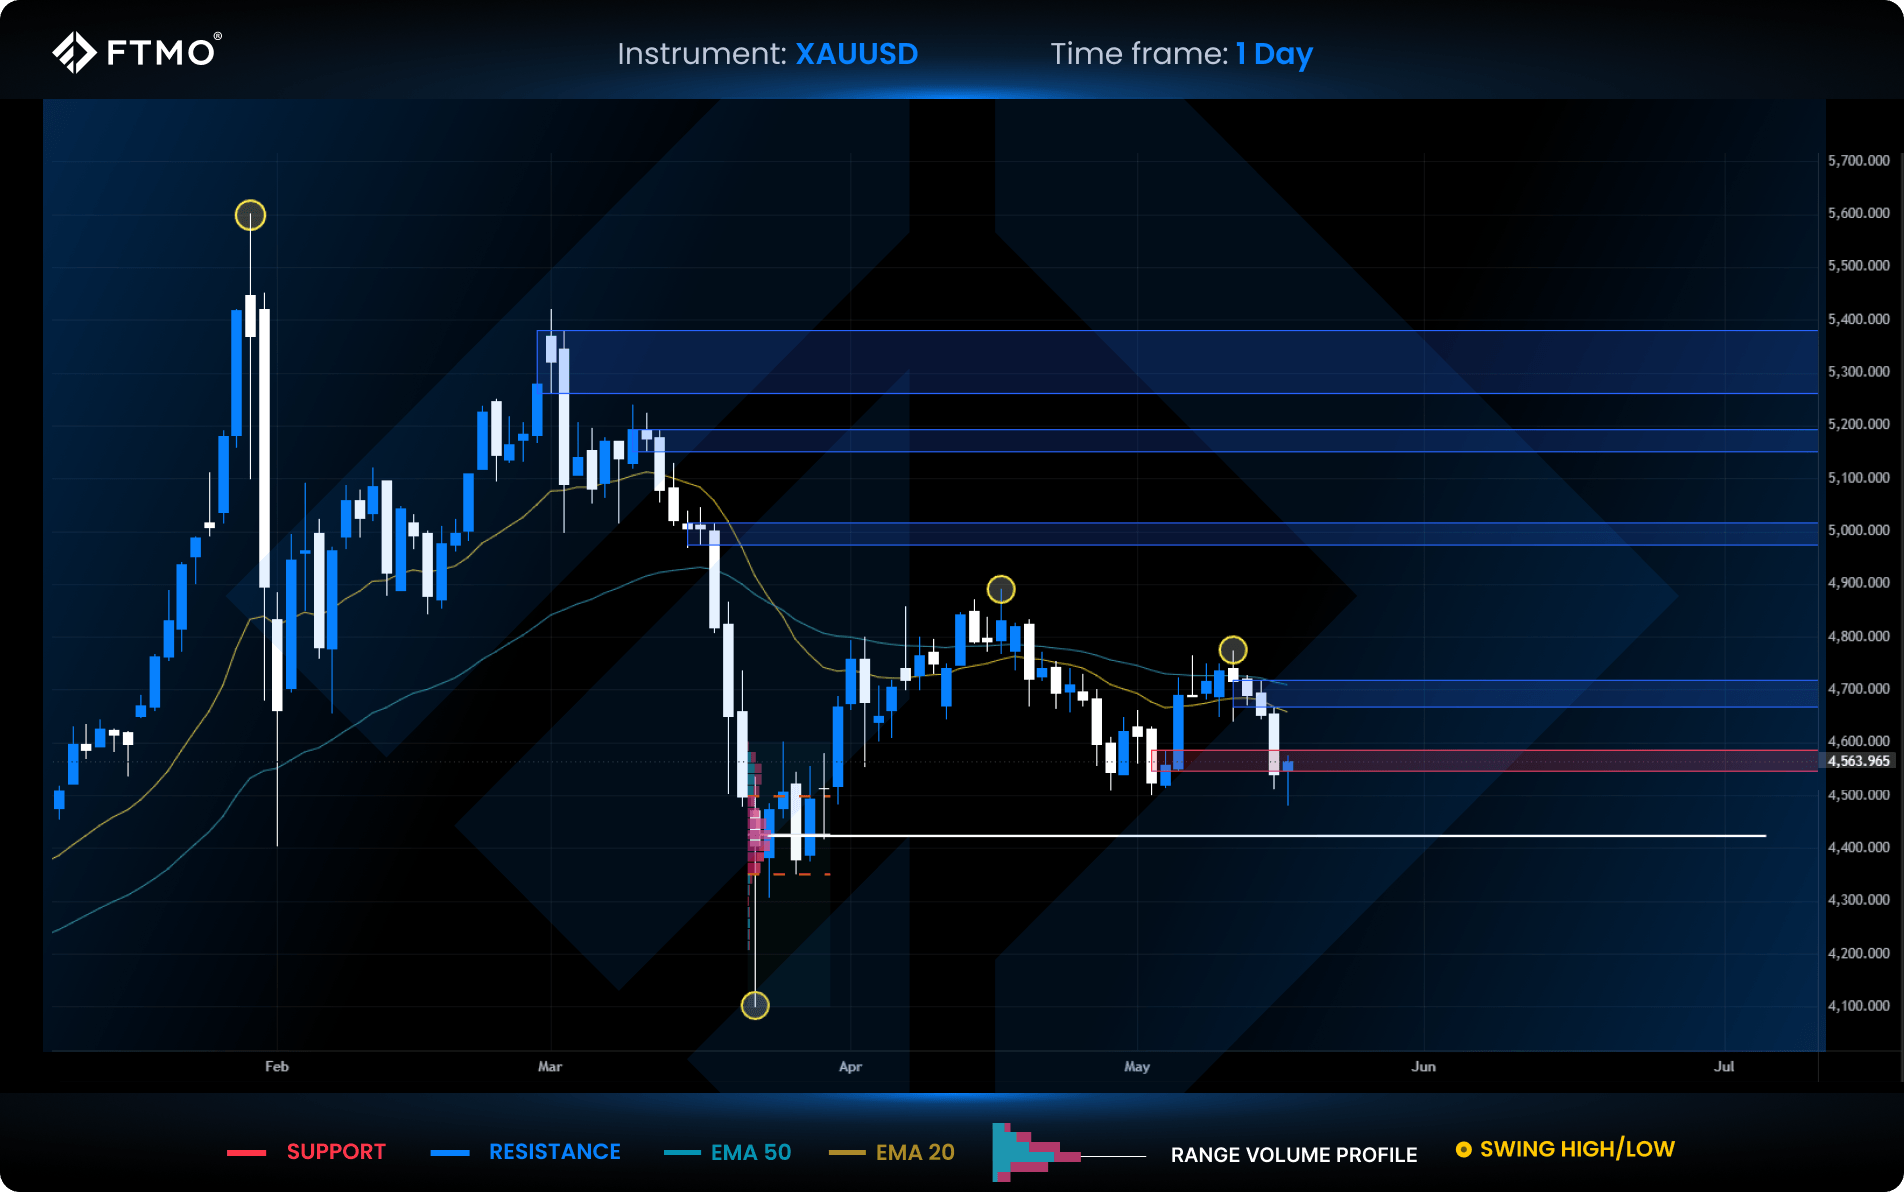
XAUUSD
Market Context: Gold is currently trading below both the 20 and 50 EMAs. On Friday, the asset experienced a sharp flush directly into a major structural support zone.
Bearish Scenario (Preferred): The preferred scenario is a continuation of the decline down to the VPOC range (marked by the white line), where a reaction is expected. If this level fails to hold, the price will likely continue falling toward the recent swing low.
Bullish Scenario (Alternative): The current support floor holds firmly, triggering a relief rally and a corrective pullback up into the overhead resistance zone.
FVG Setup: No FVG setup formed this week due to the nature of the recent price action.
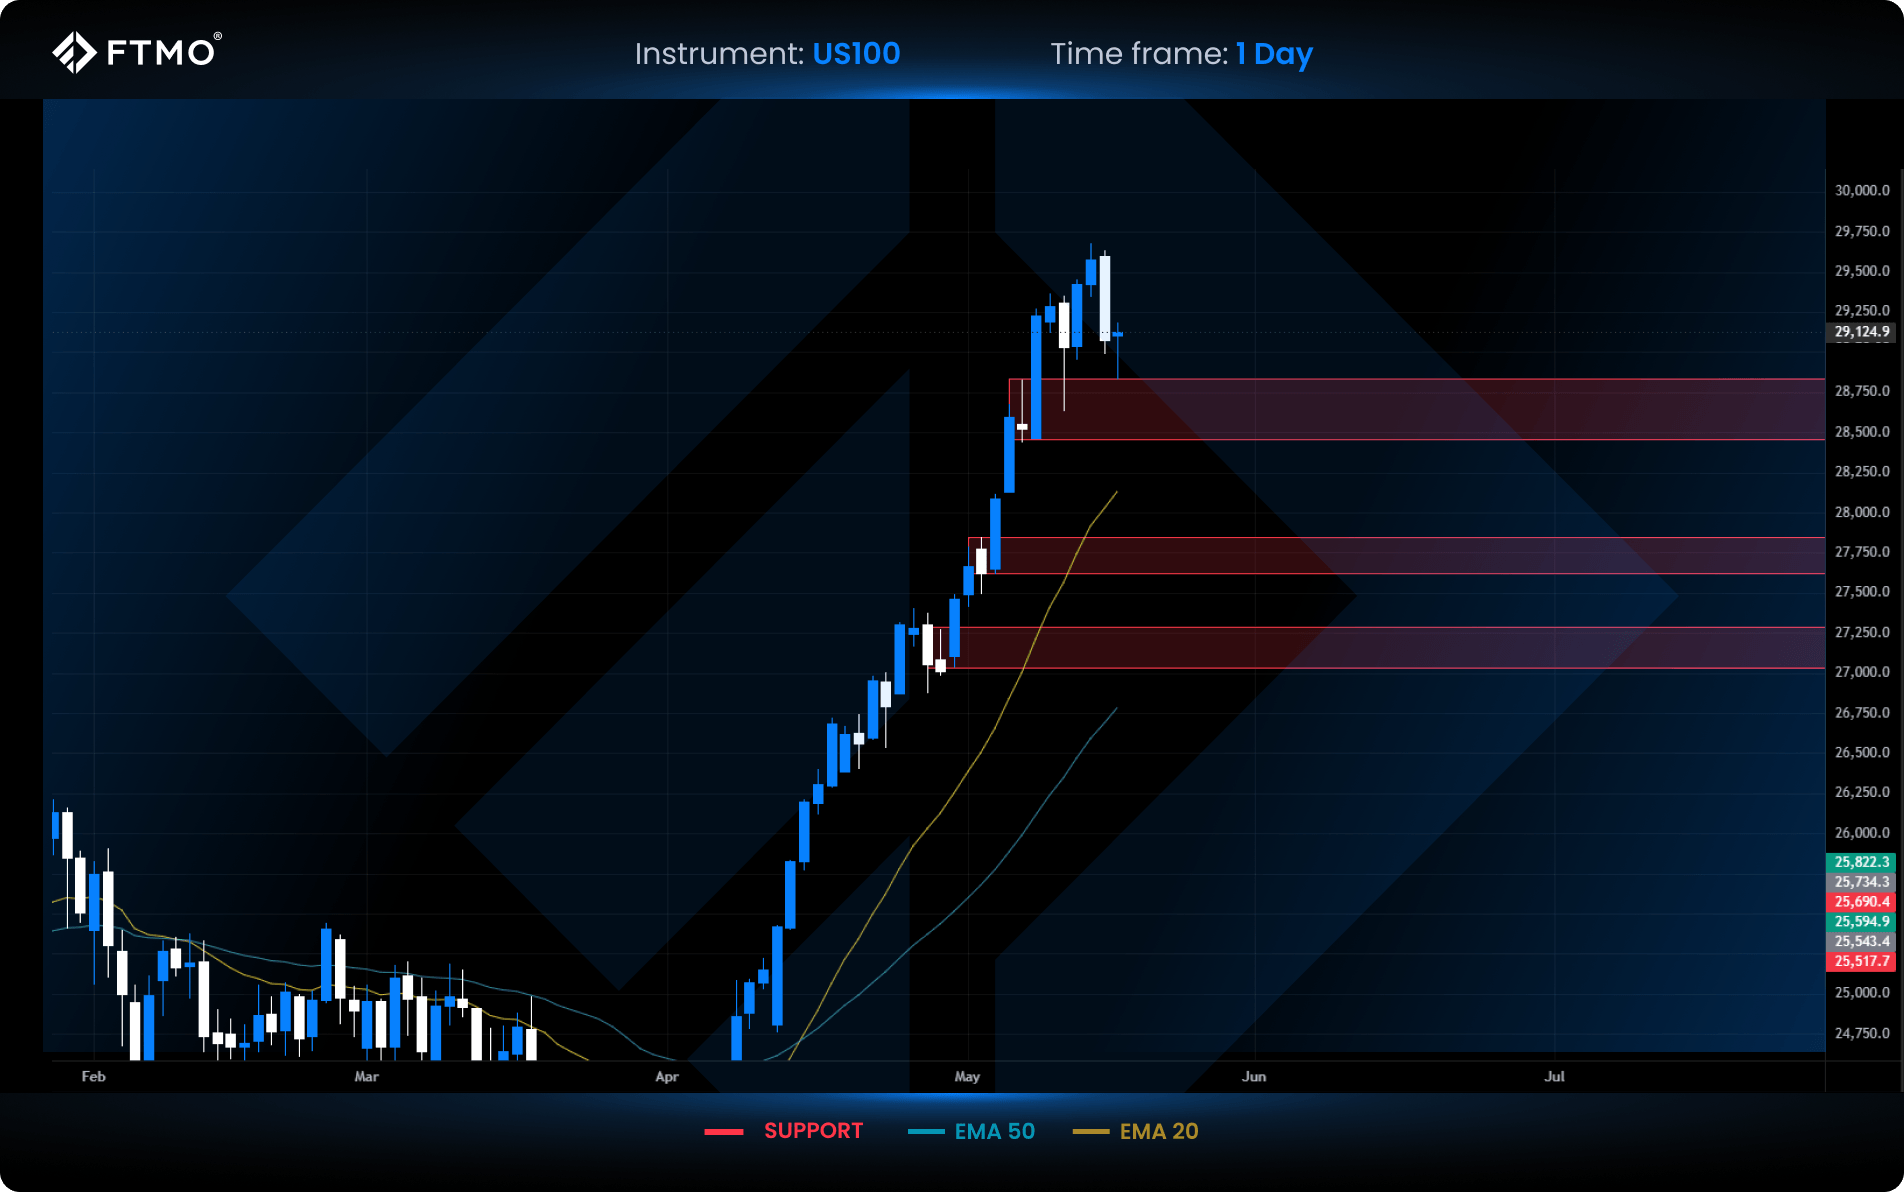
US100
Market Context: On Tuesday, the Nasdaq tested its marked support zone, which was firmly accepted by the market. Following this validation, the index rallied strongly to print a new absolute All-Time High (ATH) on Thursday.
Bullish Scenario (Preferred): The preferred scenario is a direct continuation of the dominant upward momentum into price discovery. The index remains in an exceptionally robust bullish trend, and higher prices are expected as long as the market avoids a close below structural support.
Bearish Scenario (Alternative): A daily close below the first support level. This would indicate a short-term trend shift and a cooling-off period for the current bullish regime.
FVG Setup: No new FVG setup has formed yet. Traders should monitor future sessions for the development of fresh, trend-following inefficiencies in line with the preferred bullish bias.


Related


Popular On FTMO


- As many Free Trials as you need
- Up to $200,000 account
- No time limit

Worldwide Reviews