Blog

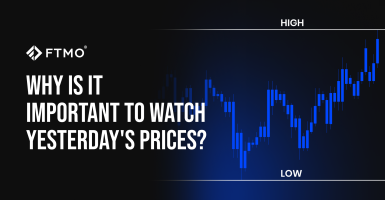
Why is it important to watch yesterday’s prices?
Yesterday's closing price, along with the daily low and high, can be important levels for traders. They provide insights into ...

How do our best FTMO Traders trade?
Discover the strategies of our top FTMO Traders! Explore the trading approaches of our most successful individuals, including a trader ...

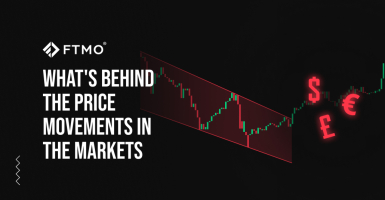
What’s behind the price movements in the markets
There are many factors and events that influence the price movements of financial instruments in forex and other financial markets ...

How to utilize investing skills for trading and vice versa?
Investing and trading have many common and similar aspects. One of the most important aspects is that they both belong ...

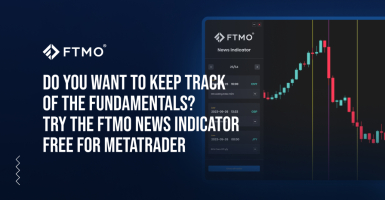
Do you want to keep track of the fundamentals? Try the FTMO News Indicator free for MetaTrader
Do you want to know when important data on inflation, interest rates, gross domestic product, or unemployment will be published? ...

Don’t get caught in the trap
Perhaps you have experienced this before. You're about to enter a position in a market that has just broken through ...

Why is it important to watch yesterday’s prices?
Yesterday's closing price, along with the daily low and high, can be important levels for traders. They provide insights into ...

How do our best FTMO Traders trade?
Discover the strategies of our top FTMO Traders! Explore the trading approaches of our most successful individuals, including a trader ...

What’s behind the price movements in the markets
There are many factors and events that influence the price movements of financial instruments in forex and other financial markets ...

How to utilize investing skills for trading and vice versa?
Investing and trading have many common and similar aspects. One of the most important aspects is that they both belong ...

Do you want to keep track of the fundamentals? Try the FTMO News Indicator free for MetaTrader
Do you want to know when important data on inflation, interest rates, gross domestic product, or unemployment will be published? ...

Don’t get caught in the trap
Perhaps you have experienced this before. You're about to enter a position in a market that has just broken through ...


