


Don’t get caught in the trap
Perhaps you have experienced this before. You’re about to enter a position in a market that has just broken through a support or resistance level because you feel you have a good signal. However, shortly after entering the market, you realise that it was only a short-term move and your trade ends in a loss. You have just fallen into a bullish or bearish trap.
The bear and bull trap is a fairly common phenomenon that mainly affects short-term traders who open positions when the price of an investment instrument breaks the support or resistance level. On longer timeframes, bull or bear traps do not appear as often, but it is possible to fall into this trap on any timeframe. In any case, these are very unpopular situations in which traders can lose a lot. And especially those who do not set Stop Losses for their trades.
Bull trap
A bull trap occurs when the price approaches a resistance level. A breakout (“ideally” also by closing the candle above resistance) can appear as a signal for traders to open a long position. However, to their unpleasant surprise, a reversal to the downside occurs and the long position ends in a loss. So the bulls are trapped and losing money.

Since detecting these traps is not easy at first glance, inexperienced traders can often face a similar situation, especially when trading on charts with low timeframes. Add to this an incorrectly set Stop Loss or unnecessarily large positions and a series of similar trades can cost a trader a lot of money and make him/her frustrated.
Bull traps can often occur in uptrends, where they usually signify a trend reversal. It can also occur in downtrends, where it lurks for traders on pullbacks where a trendline or short-term resistance can be broken. It is effectively a false trend reversal that eventually continues. There are no exceptions when the market moves in a range and after several bounces off resistance there is a breakout which traders perceive as a strong buy signal that turns out to be false.
Large market players who take advantage of trend changing situations are then responsible for these traps. In places where demand is running low, these players can open larger positions to take advantage of the last opportunity to benefit from the uptrend and push the price above resistance in the short term. Retail traders there will also be convinced that the uptrend will continue. Further price increases will allow the big players to exit the market at a better price. Therefore, the increasing volume of short positions will push the price down and retail traders will have no choice but to realize losses on their stop losses. This makes the price drop even more noticeable.

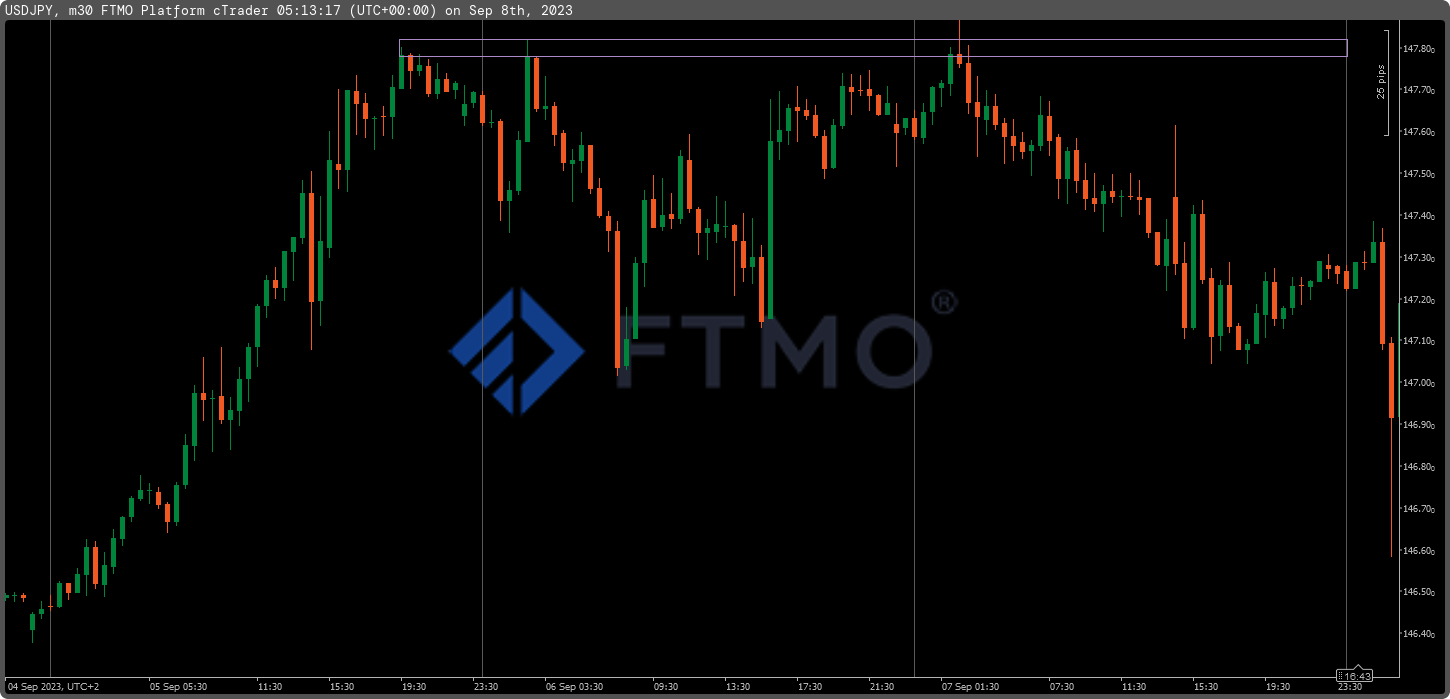
The first image shows a bull trap after an uptrend, which should not be a big problem for more experienced traders. In fact, the candle that broke above resistance did not close above resistance and ended up forming a pretty good Evening Star candle pattern. Thus, the problem could only occur with impatient traders who enter the position too early.
Bear trap
A similar situation, but in the opposite direction, is a bear trap. This is a danger for traders who enter the market after breaking the support level. The reasons for the emergence of a bear trap in the Forex market are similar to those of a bull trap, i.e. here again it can be caused by big players creating the appearance of a reversal of a downtrend in the market. A bear trap often only appears at the end of a downtrend, but it can also appear as a false reversal in an uptrend, or as an invalid break of support when prices have been range-bound for some time.
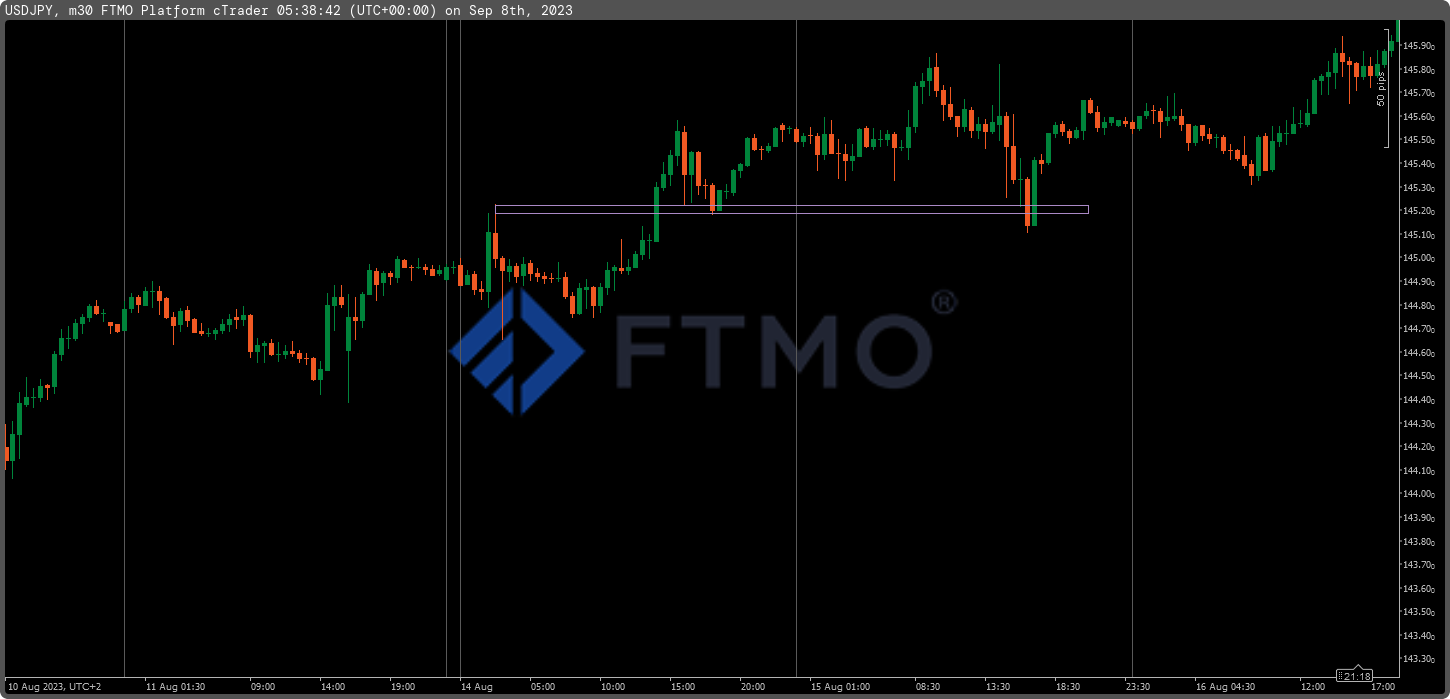
In the image below we see a situation where the price made a new high after the pullback formed but then fell below the support level formed by the pullback, which could look like a possible trend reversal. Inexperienced traders might have gotten the impression that the price would fly down, but the more experienced ones, who do not rush into every trade, might have waited, which would have paid off in the end.
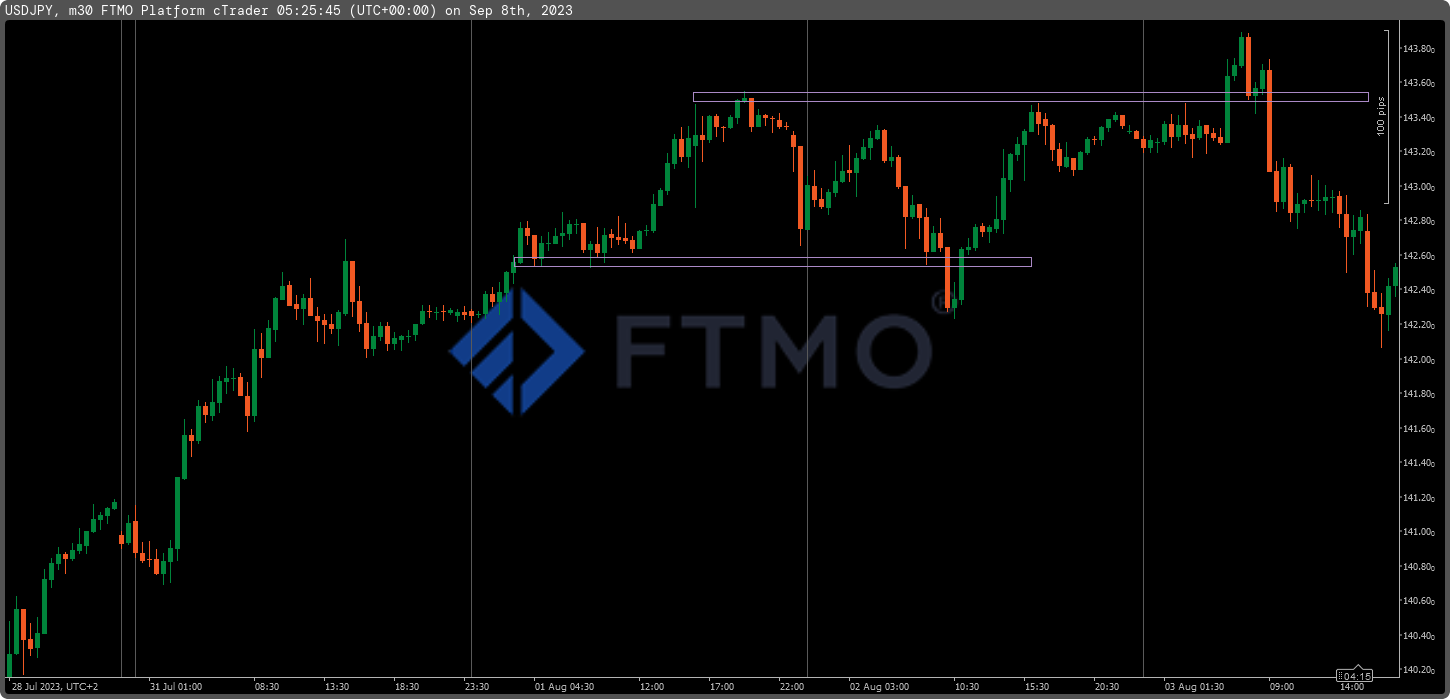
In the next image we see how cruel markets can be to traders at times. First, in an uptrend, a bear trap appears, where the short candle closes quite deep below the support level, only to form another Morning Star candle formation on the chart. At the same time, a resistance level forms on the chart, which the price clearly exceeds again, forming a bull trap and then falling back down. In this case, there was even a pullback and a short-term confirmation of the upward move, only to eventually see the price fall and another potentially losing long trade. In this case, even the more experienced traders might have been taken by surprise.
How to trade bear and bull trap?
In general, one of the most important weapons against these traps is to patiently enter the market and limit entries when the price is at the top and the bottom of the range. In short: every trend has to end at some point. That’s easy to say, but implementing it is perhaps a little harder. However, the examples given show that a trader who is not hasty and can wait for the move to be confirmed (admittedly, in one case even that didn’t help, but losses are part of trading) usually doesn’t need to get trapped. At best, he can use this trap to his advantage and enter the opposite position.

Bear and bull traps are often the source of interesting opportunities created by candle formations. Therefore, it is very important to observe the sizes and shapes of the candles that are breaking the resistance and support levels. Another option is to use indicators and combinations of indicators. Oscillators can also be used to enter overbought and oversold markets, or form divergences that can reveal these traps before they form.


- As many Free Trials as you need
- Up to $200,000 account
- No time limit

Worldwide Reviews