


How to trade candlestick patterns?
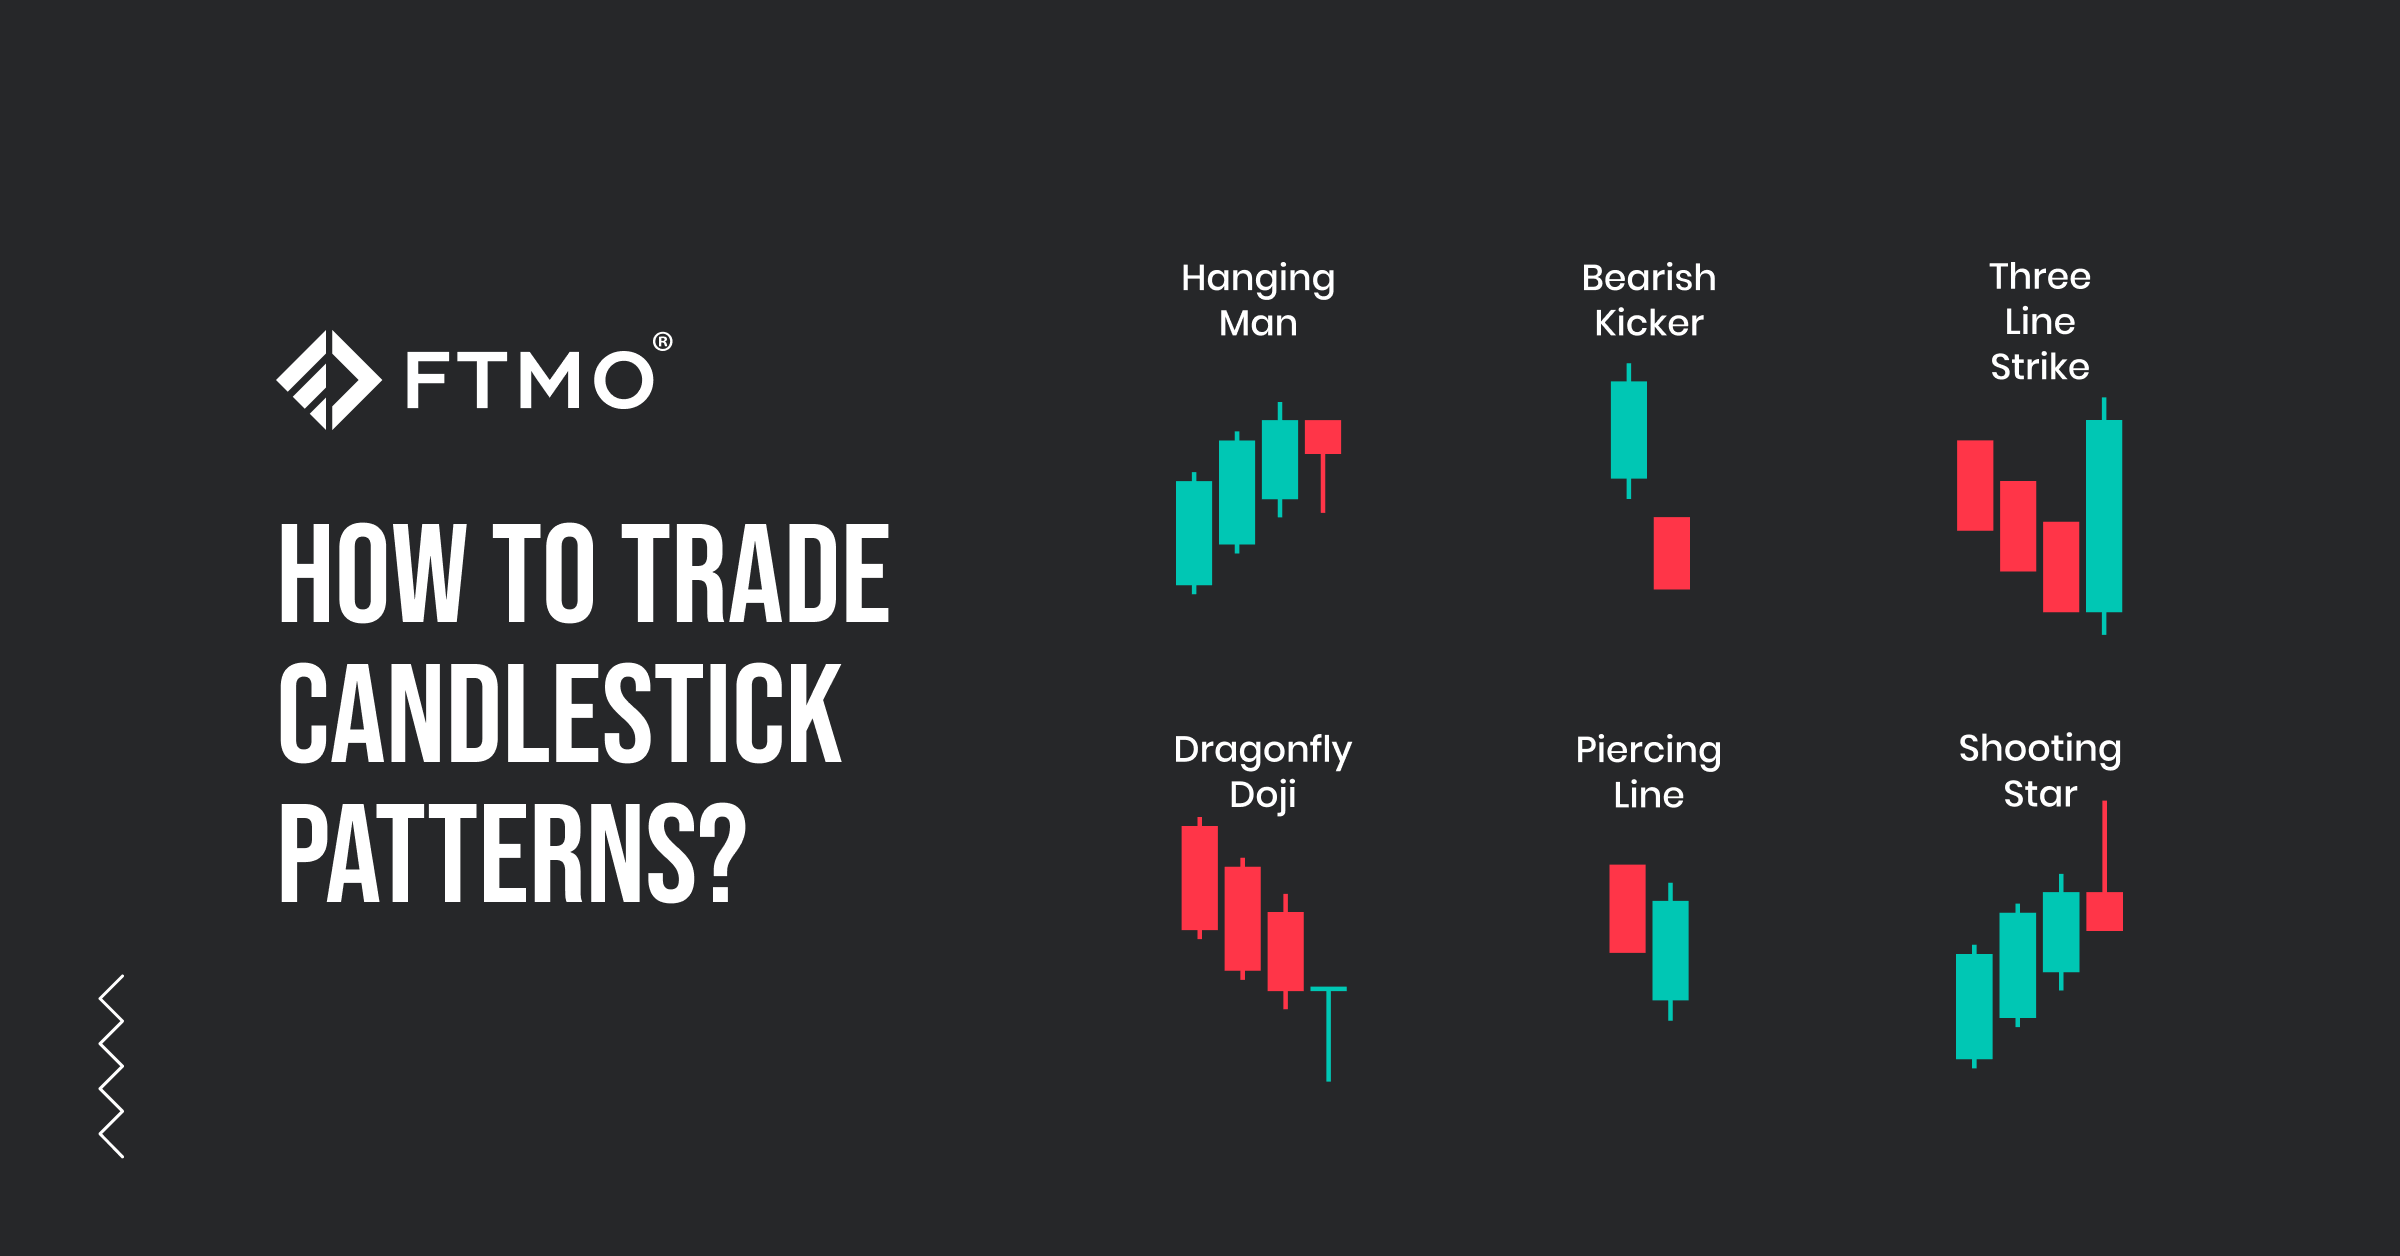
Based on the historical data, the discovery of Japanese candlesticks can be dated back to the 18th century. However, this concept gained popularity in the West in the 90’s thanks to Steve Nison and his book called Japanese Candlestick Charting Techniques. In this article, we’ll have a look at the basics of Japanese candlesticks and discuss the most popular candlestick patterns. Of course, candlestick patterns are only one of the basic concepts of technical analysis and should serve as a supplementary factor in technical analysis. Trading in financial markets is a complex process and requires an in-depth analysis and knowledge of the market.
Candlestick basics
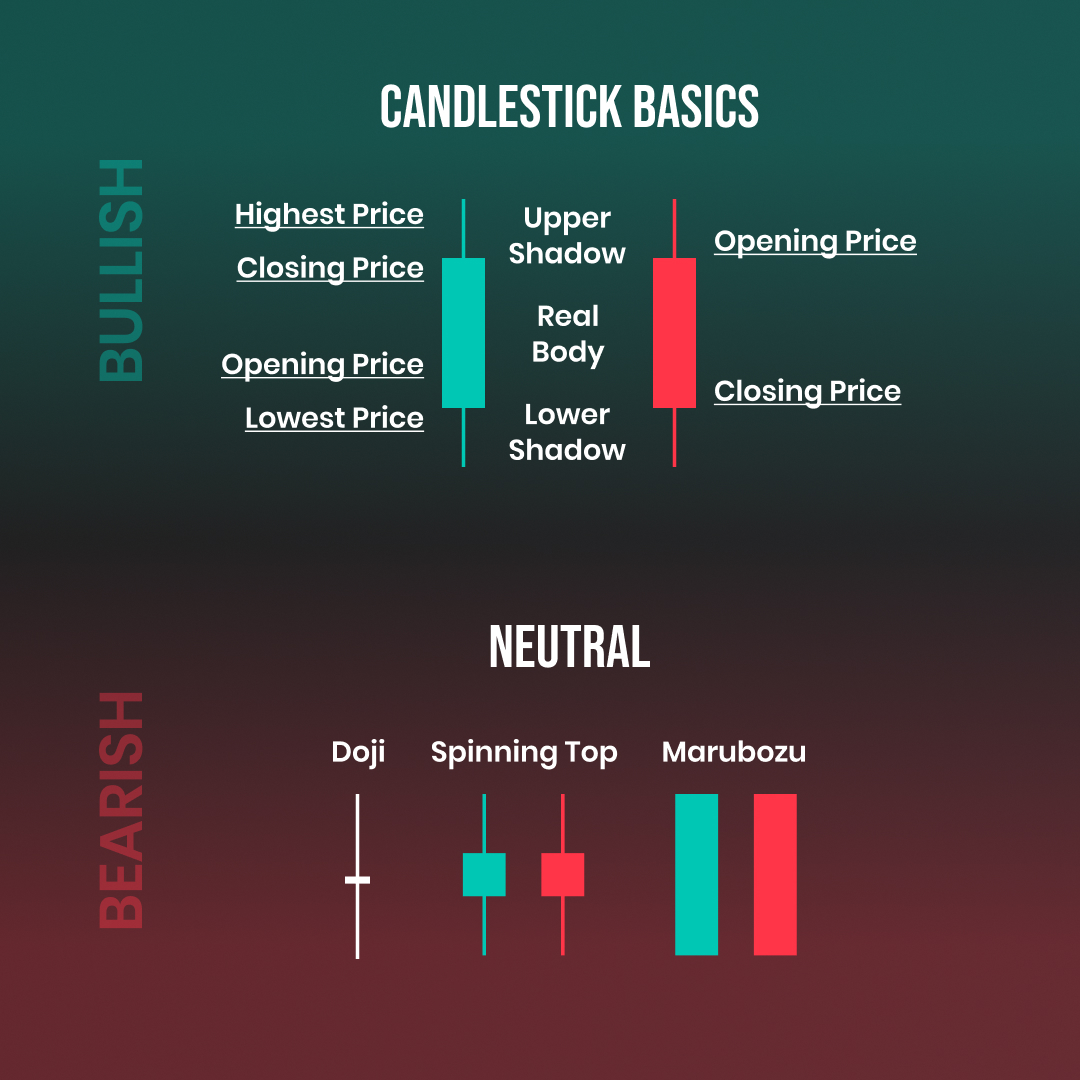
Japanese candlesticks, just like bar charts, perfectly describe 4 important pieces of information about the price for a certain period of time. They show the OHLC prices that are important in order to understand the behaviour and the price movement with only one small difference. Japanese candlesticks may give a more emotional representation of the price. On the left (green) we can see the bullish candlestick. The wick pointing to the bottom is called the lower wick or lower shadow and the tip represents the lower price. The start of the rectangle from the bottom is the opening price. The end of the rectangle above is the closing price. The bullish candle is usually coloured in green signaling that there was an increase in the price.
On the other hand, we have bearish candlesticks, that are the complete opposite of bullish candlesticks. The opening price is the upper start of the rectangle and the closing price is the lower end of the rectangle. The body, which is the size of the rectangle, indicates the price increase/decrease. The colouring of bearish candlesticks is usually red by default, however, it also depends on everyone’s preferences.
Single Candle Patterns
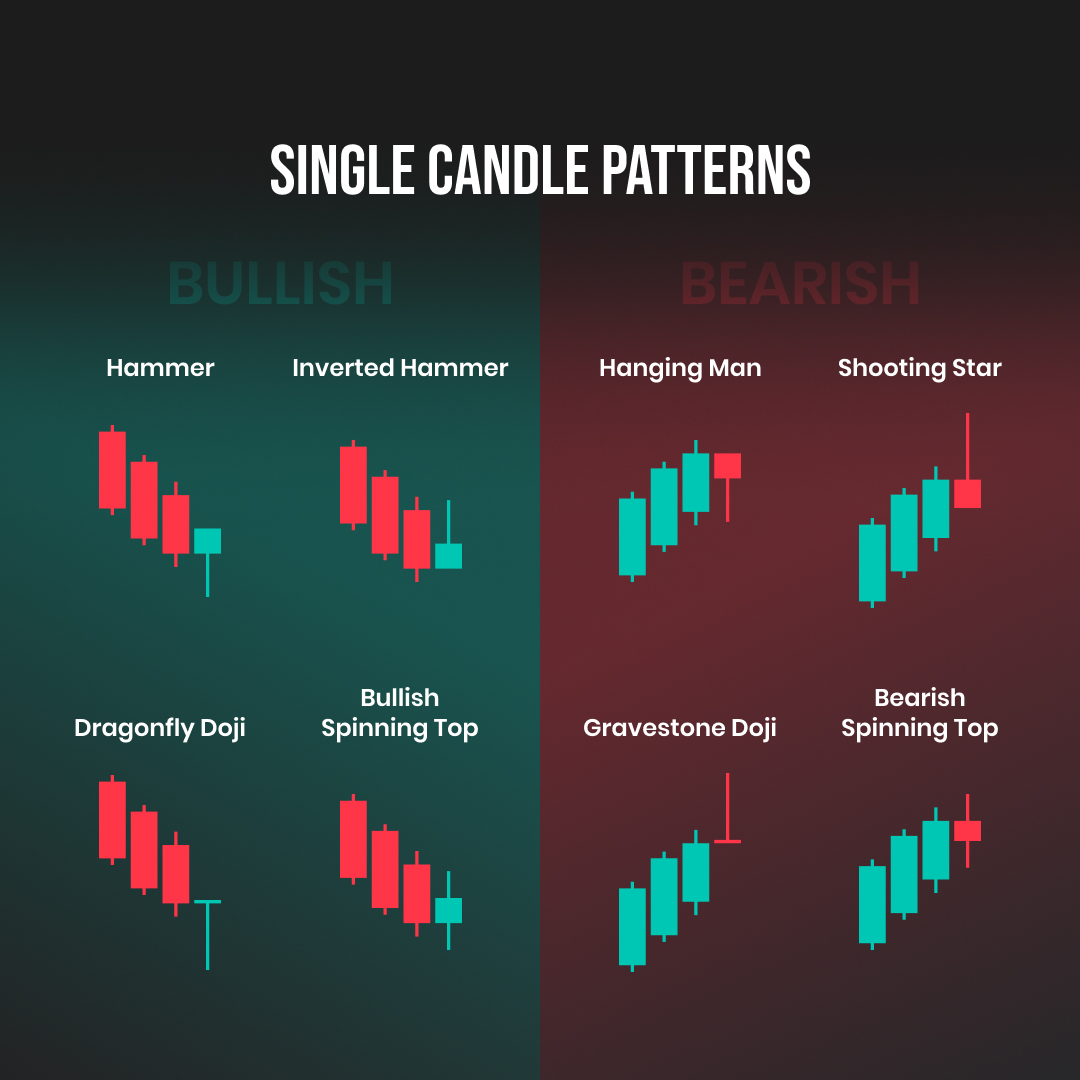
Among the first candlestick patterns, we have single candlestick patterns that are divided into bullish and bearish patterns. Usually, when these patterns occur in the market, they provide a signal that the price may reverse at a given time. Of course, candlestick patterns alone cannot be considered as an absolute confirmation for price predictions and must be used in conjunction with other technical and fundamental analysis tools. The most popular bullish candlestick patterns are the Hammer, Inverted Hammer, Dragonfly Doji, and Bullish Spinning Top. After a consecutive decrease in the price, the occurrence of these candles indicates a potential price reversal. The Hammer and Inverted Hammer candlestick patterns, as the name suggests, have the body and the wick shaped in the form of a hammer. The Dragonfly Doji has a very short body and a long downside wick and the Bullish Spinning Top is characterised by a square-type body with two equal wicks or shadows to the upside and downside.
Bearish single candlestick patterns, on the other hand, provide signals of price reversals to the downside as they usually occur after a consecutive increase in prices. If their occurrence does not happen after a consecutive increase, the conditions are therefore not respected, and the signal is not clear and cannot be considered as valid. The most popular bearish single candlestick patterns are the Hanging Man, Shooting Star, Gravestone Doji, and Bearish Spinning Top. The shapes of the Hanging Man and the Shooting Star, as you can see, are very similar to the Hammer, however, there are huge differences. The main difference is that the Hanging Man and the Shooting Star are bearish candlestick patterns which mean that, apart from the Hammer and the Inverted Hammer candlestick patterns which are bullish, their opening price is at the lower side of the body and the closing price is at the upper side of the rectangle, the opening price of the Hanging Man and the Shooting Star is at the upper side of the rectangle and the closing price is at the lower side of the rectangle. The same applies to the Gravestone Doji to the Dragonfly Doji and the Bearish Spinning Top to the Bullish Spinning Top.
Double Candle Patterns
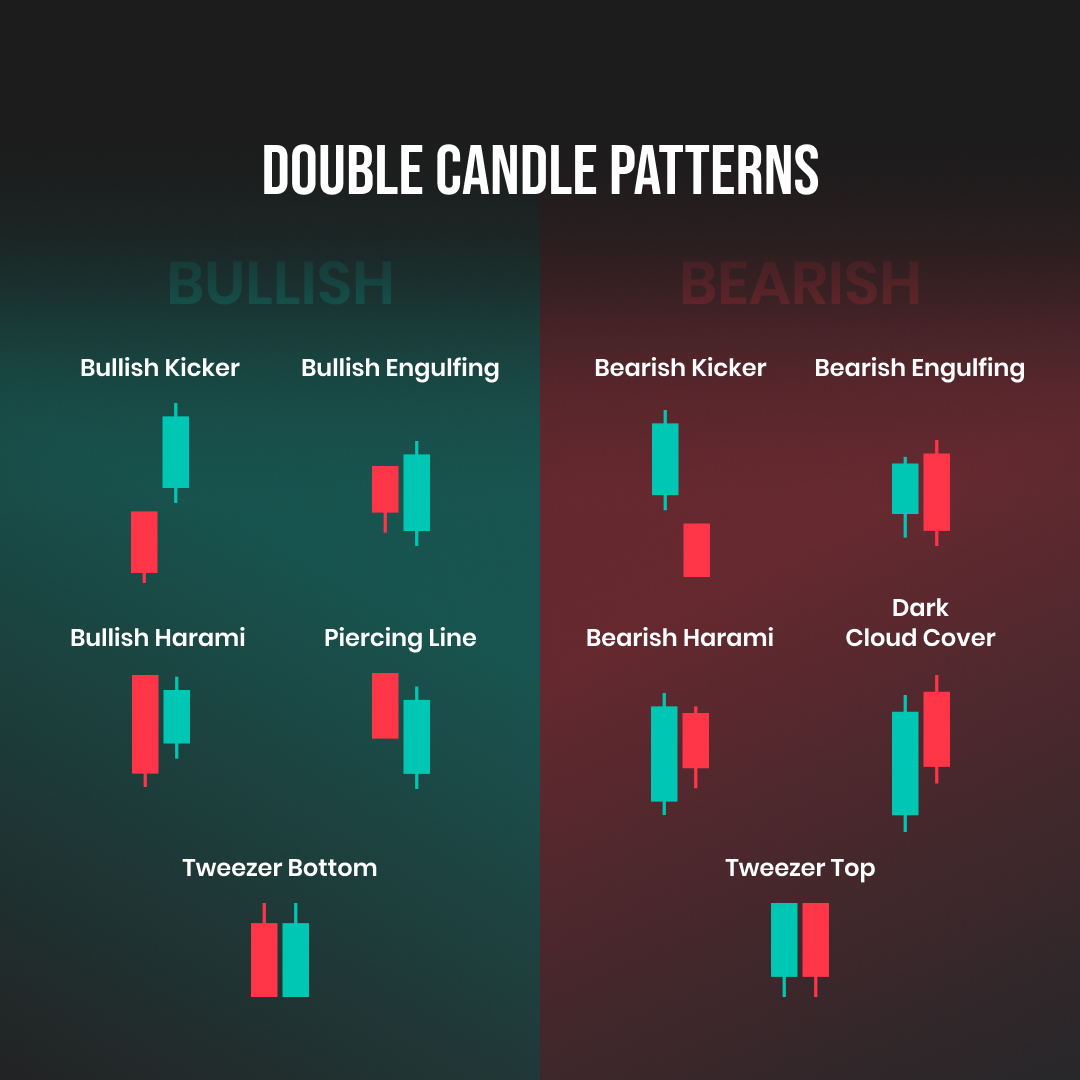
Then we have double candlestick patterns. Among the bullish candlestick patterns, there are the Bullish Kicker, Bullish Engulfing, Bullish Harami, Piercing Line, and Tweezer Bottom. The bullish Kicker candlestick pattern is characterised by a gap to the upper side which is a strong indication that the price may continue to trend upwards. The Bullish Engulfing appears on the chart with a bullish candle with a body longer than the one that appeared before. When these candlesticks appear together they usually signal a bullish trend. The next one is the Bullish Harami which starts with a long bearish candle and is followed by a bullish candle that has a body shorter than the previous bearish candle. There is also the Piercing Line which starts with a bearish candle and the open of the next bullish candle is lower than the close of the previous bearish candle. The second candle must close above the midpoint of the first candle. Lastly, there is the Tweezer Bottom. This Candlestick pattern is usually characterised by two bottoms at almost or the exact same levels, however, the first candle is a bearish candle and the second one is a bullish candle which means the closing price of the first candle and the opening price of the following candle are at almost or the same level. Both candles have no wicks to the downside but have a wick to the upper side.
Then we have the bearish double candlestick patterns. These patterns are known as the Bearish Kicker, Bearish Engulfing, Bearish Harami, Dark Cloud Cover, and the Tweezer Top. The Bearish Kicker is very similar to the Bullish Kicker with the difference that it’s on the other side and it is characterised by a gap to the downside which is a strong indication that the price is starting to trend downside. Then there is the Bearish Engulfing which starts with a bullish candle and is followed by a bearish candle that has a body longer than the previous bullish candle. Another candlestick pattern is the Bearish Harami. This double candlestick pattern usually starts with a bullish candle that has a body longer than the following bearish candle. However, the following bearish candle opens and closes within the range of the body of the previous bullish candle. Another popular double candlestick pattern is the Dark Cloud Cover. It begins with a bullish candle followed by a bearish candle that opens higher than the close of the previous bullish candle. The second candle closes below the midpoint of the prior bullish candle. The last double candlestick pattern is the Tweezer Top. The characteristics of this pattern is the same as the tweezer bottom with the only difference being that the first candle is a bullish candle and the second one is a bearish candle. They usually do not have any wicks to the upper side but they have wicks to the downside.
Triple Candle Patterns
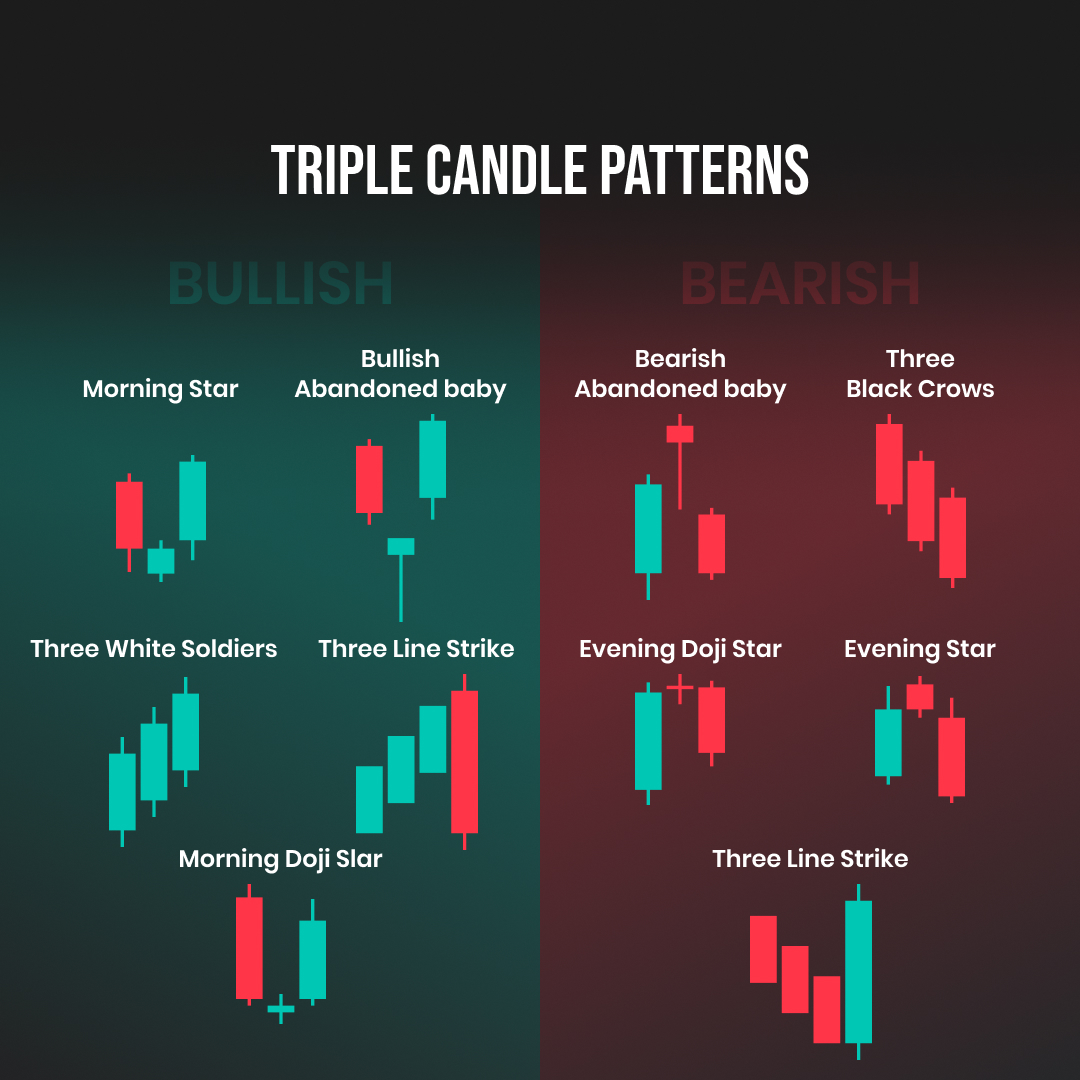
Triple candlestick patterns are patterns that consist of three candlesticks. When these patterns form, they are usually considered to be the strongest indications of the next price movements, as opposed to the single and double candlestick patterns when they may sometimes provide a false signal. The most popular bullish triple candlestick patterns are the Morning Star, Bullish Abandoned Baby, Three White Soldiers, Three Line Strike, and the Morning Doji Star. Among the bearish triple candle patterns, there are the Bearish Abandoned Baby, Three Black Crows, Evening Doji Star, Evening Star, and the Three Line Strike. As you can see in the picture, these patterns signal trend reversals.
Conclusion
In this article, we have covered the basics of Japanese candlestick patterns, as well as the most popular candlestick patterns out there. Of course, none of the content in this article shall be considered as investment/trading advice and these techniques should only be used in combination with other technical and fundamental analyses and tools. For example, if the Dollar Index is going to strengthen due to increases in the interest rates by FED, trend reversal candlestick patterns may not be a solid signal to enter a short on the Dollar Index but in the opposite direction. You may want to wait for a retracement to follow the trend. There are traders who use candlestick pattern techniques as supportive tools for their technical analysis, however, there are also traders who claim that these do not work and would never touch them. Japanese candlesticks and candlestick patterns have been used by traders for hundreds of years and even though there are traders who swear they would never use them, they are one of the basic concepts of technical analysis.


- As many Free Trials as you need
- Up to $200,000 account
- No time limit

Worldwide Reviews