


How to Make Smarter Decisions with Volume Weighted Average Price?
Volume Weighted Average Price is an indicator based on volume weighted average price. On the chart, it is shown in lines that cross the chart. Its advantage is that it is not only calculated based on price but also on the volume of trades.
What is VWAP (Volume Weighted Average Price)?
The volume of trades is the most important technical analysis indicator for a large number of traders, which gives the VWAP its importance. By using the VWAP, we can find out not only the direction of the trend in which the market is going but also possible reversals.
How is VWAP calculated?
VWAP is calculated as the sum of the price of each trade in a given time interval multiplied by the volume of trades, and then this sum is divided by the total number of trades for that time.
VWAP = ∑ Price x Volume at price / ∑ Total Volume
How to use VWAP
VWAP is used not only in trading but also in investing, where it can identify liquidity points, whether we bought or sold at a fair level. If we bought below the curve of this indicator, we can consider it a good buying level because it means the market is in a strong selling trend and it is being oversold. When we sell, it is good to sell above the curve of this indicator. This indicates that the market is overbought, which means the potential reversal might come.
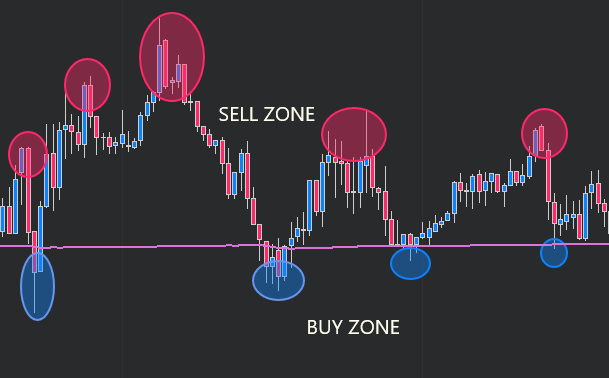
This method of selling and buying shows us zones of either strong long activity with a probability of a reversal or, on the other hand, strong selling activity with a possible reversal into a bullish trend. It is also very popular, even among large institutions. Where they use a different setup of the VWAP, and it's in seasons. It can be the monthly season, weekly season, or even bigger.
How can it help you in your trading?
Trend indicator
VWAP helps traders determine the direction of the trend. When the market is above the VWAP curve, it means a bullish signal of a dominance of buyers. Conversely, if the market is below this curve, it indicates a bearish signal.
Support and resistance level
The VWAP also has the benefit that its curve and deviations serve as a very strong support or resistance, and often the market has a reaction to it.
Helps make entry and exit decisions
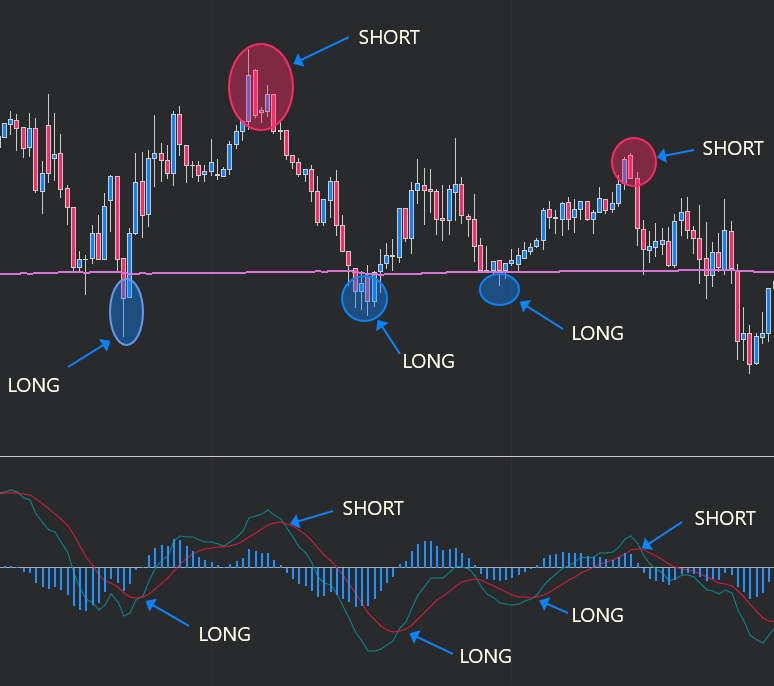
If the price gets above the curve and then retraces, it can signal an entry into the LONG.
And if the price gets below the curve and goes back to it, it can signal an entry into SHORT.
How to Use VWAP in Your Trading Strategy
Zone of support and resistance
VWAP is a popular tool, especially for day trading, because its values are always reset at the beginning of each trading day. Its use can be as an indicator that shows us the trend, and we use it with the next method just as a confirmation to enter the trade.

For example, we have a strategy based on the breakout of the inside bar, and we use the VWAP as support or resistance, so when the breakout of the inside bar appears on the curve of the VWAP, we enter there.
VWAP trading strategy
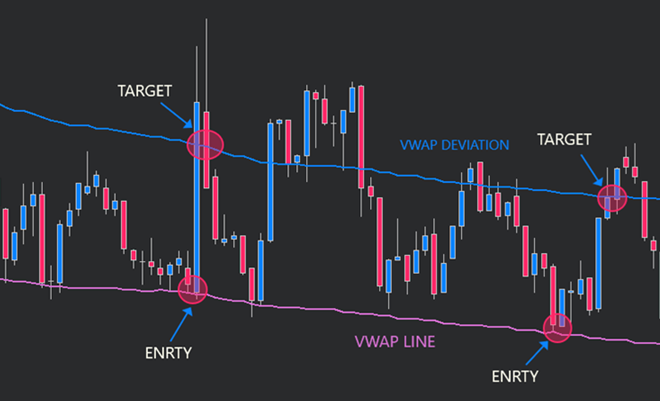
Another use can be a strategy directly based on VWAP where we enter and exit the trade based on VWAP without another indicator or price-action pattern.
The pullback strategy is a simple strategy based on the technical analysis of identifying the trend according to the VWAP and returning to the VWAP level. So if the price is above the VWAP, it indicates long activity, and if the price is below, it indicates short activity.
Entry rules
Long
The price must be above the VWAP level, then we wait for a pullback to the curve, and the entry will be exactly on the VWAP level.
Short
The price must be below the VWAP curve, and as with a long position, the entry point is at the VWAP level.
Exit rules
Stop Loss
Is fixed below or above the VWAP level according to the direction of the position.
Take Profit
On the next VWAP deviation or trailing if you have a larger position.
VWAP vs. SMA (Simple Moving Average)
Both of these indicators are very popular with traders, but each counts differently, and each has a slightly different use.
VWAP
It is used mainly in day trading because its values are the most accurate there, although it can also be used in long-term investing. But it is not so reliable, and it is necessary to use other technical analysis tools with it. VWAP is calculated as the sum of the price of each trade in a given time interval multiplied by the volume of trades, and then this sum is divided by the total number of trades for that time.
SMA
SMA is a simpler indicator calculated from the average price, but it does not include volume, which is an important parameter for technical analysis. SMA can also be used in swing trading and also in day trading, but there, due to the lack of volume, it is not as powerful an indicator as VWAP.

Which One Should You Use?
It depends on whether you are a day trader or a swing trader. If the length of your trades is in the order of minutes, it is certainly worth considering using VWAP, which is a more sophisticated indicator incorporating several technical analysis tools, both price and volume. On the other hand, with the Simple Moving Average, it is better to use it for longer trades in a series of hours to days.
Advantages and Disadvantages of VWAP
VWAP advantages
Calculated from volume and price
Its biggest advantage is that it is calculated not only on the basis of price but also on volume, which is more important in trading than price because it shows us the levels where traders were willing to trade the most, known as the zone of interest.
Determines the exact support zones and resistances
VWAP shows us not only the possible area of support and resistance but also the exact place where the support and resistance are.
Identifies the direction and strength of the trend
It can easily and quickly show us the direction the market is in without the use of other technical tools.
VWAP disadvantages
Use at the beginning of the trading day
One of the disadvantages of the VWAP is that it cannot be used right after the market opens at the beginning of the day because there is not yet enough data to calculate for the indicator to be accurate. The more the day develops, the more its accuracy increases.
VWAP is based on historical values
Just like any other indicator is calculated from historical values, so is VWAP, which can be a problem in trading because it does not react to what is happening but to what has already happened.
Usage in trending days
VWAP can work perfectly on non-trend days, but trend days can be a problem because there are not many opportunities to enter, and it can also happen that the market does not react to a variance on strong trend days.
How to Combine VWAP with Other Indicators for Better Results
The VWAP is best used with another indicator or price action pattern because they can better tell us the continuation of a trend or a possible change of direction with precise entry and exit.
MACD indicator
MACD is a trend-following technical indicator that shows a difference between two lines, the MACD line and the Signal line. After RSI, it is the most used indicator in technical analysis. It shows up on the chart in the form of a histogram with two lines: MACD line and Signal line, calculated purely on the basis of moving averages, specifically EMA 12 and EMA 26.
Example
For example, if the price is above the VWAP, it is a sign of a bullish trend but also a potential reversal to the short, and we want to see the same confirmation on other indicators such as MACD, where we will wait for the MACD line to cross with the signal line. The MACD is not the only indicator we can do this with. We can also find similar uses with other indicators.
RSI indicator
Relative Strength Index is a momentum oscillator that measures the speed and magnitude of price movements on a scale of 0 to 100. Traders are using this scale to indicate the overbought and oversold conditions of the market and estimate potential trend reversals based on this.
Example
If the value on the scale is higher than 70, it means that the market is overbought and there is a probability of a short position. On the other hand, if the market falls below 30, it indicates an oversold condition with the potential for a long position. This can be used together with VWAP as a signal to enter if both of the signals match.
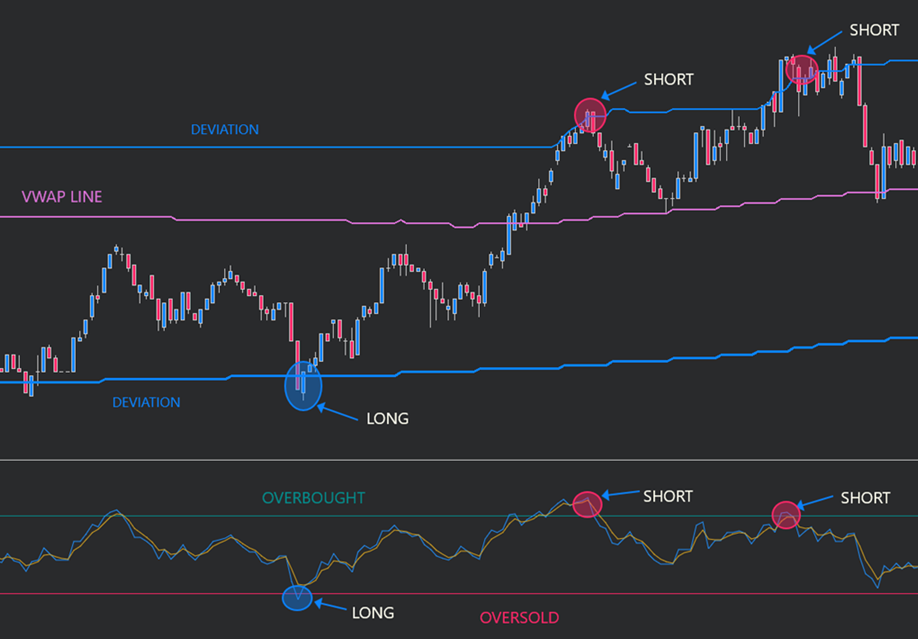
In this case, if the market is in the zone of overbought or oversold and at the same time on the VWAP line or on its deviations, then VWAP works as a support and resistance, and RSI determines the direction of the trade.
Bollinger Bands indicator
Bollinger Bands was invented by John Bollinger in 1983, and it is based on the same principle as RSI. You can find it on the chart in the form of three lines. The central one is calculated on the basis of the 20-day Simple Moving Average (SMA) of the price, and the others are above or below this line and serve as deviations.
Example
When the price is reaching the upper Bollinger Band (deviation), we can assume that the market is overbought (SHORT), and the same applies for oversold (LONG).
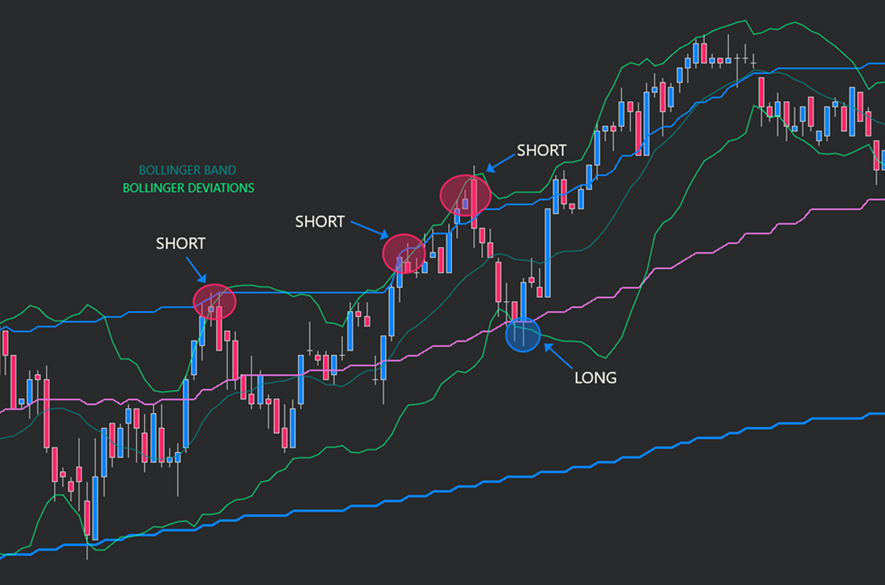
Bollinger bands can be used with a VWAP based on their deviations. If the price reaches the upper deviation of the VWAP and at the same time the upper deviation of the Bollinger bands, it is a signal to short, and oppositely, if the price reaches the lower deviations of the Bollinger bands and VWAP, it is a signal to long.
Conclusion: Why VWAP Should Be Part of Your Trading Toolbox
To sum up, VWAP is a useful tool for traders. It can improve their strategies, especially when used with other indicators such as MACD, RSI, ATR, or stochastic oscillator. With VWAP, you can combine a wide range of indicators, the most common ones can be found here. VWAP can make your trading decisions more accurate. It's definitely worth adding the VWAP to your strategy and trying it out, whether you're trading during the day or swing trading. It can give you better control over your trades and maximize your success.

About FTMO
FTMO developed a 2-step Evaluation Process to find trading talents. Upon successful completion you can get an FTMO Account with a balance of up to $200,000. How does it work?.