


Technical analysis – Bollinger Bands as a combination of trend and volatility
Bollinger Bands are one of the most famous and popular indicators that track an investment instrument’s trends and volatility. Why is it of so much interest to investors?
Bollinger Bands is one of the indicators which is based on bands or envelopes that mark the relative representation of the maximum and minimum prices of an instrument. There are several similar approaches in technical analysis where bands mark the upper and the lower price ranges, and the basis for bands can be maximum and minimum prices (Donchian Bands), cycles (Hurst Bands), or percentages above/below the moving average (Percentage Bands) or price.
Bollinger Bands may not have been the first among such indicators, but they are certainly among the best-known indicators using bands to identify oversold or overbought levels in an investment instrument. Technical trader John Bollinger developed this indicator in the 1980s.
Trend and volatility
It is not a classical trend indicator but rather an indicator that uses standard deviation as a measure of the volatility of an investment instrument when determining bands and their distance. As Bollinger himself states, volatility is a dynamic variable that changes over time, and it is the attachment of this indicator to volatility that sets it apart from other purely trend indicators.
The formula used to calculate both bands is:
Upper band = MA(TP,n) + m * δ[TP,n]
Lower band = MA(TP,n) – m * δ[TP,n]
MA – moving average
TP (typical price) – (high + low + close) / 3
n – number of days in period (typically 20)
m – number of standard deviations (typically 2)
δ [TP, n] – standard deviation over last n periods of TP
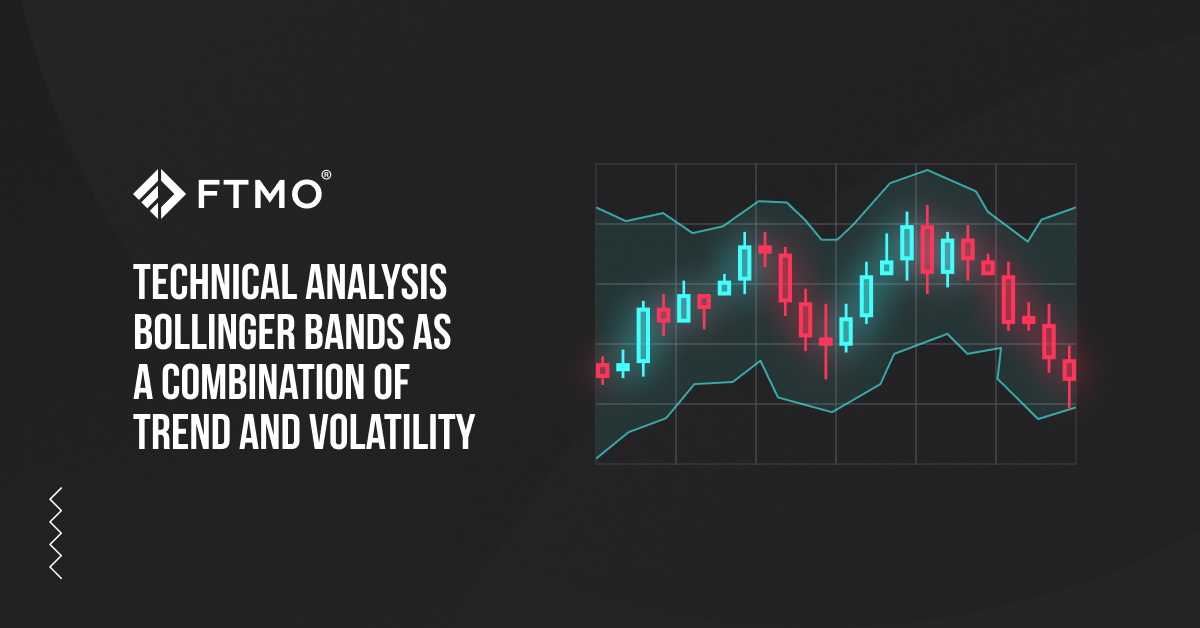
On the chart, the Bollinger Bands are then displayed as three lines. In the middle is the classic moving average with a period of 20, and then two bands the distance to which is not the same (unlike for most other similar indicators) but is determined by two standard deviations from the middle line.
When the bands are wide apart, it means that the volatility in the market is high, the trend is strong, and a correction may occur; on the other hand, when the bands are close together, the volatility is low and a new trend may form. Individual values, such as the number of periods or the multiple of the standard deviation, may vary; different values may be more appropriate for different instruments. However, it should be considered that when using MAs with longer periods, the standard deviation multiple also needs to be increased. For an MA of 50, it is at least 2.1; for a shorter period, it is less than 2.

What to beware of
Many traders make the mistake of considering the instrument’s reaching the upper or lower price band as a sell or buy signal, respectively. However, this is not true. Directly on the website dedicated to this indicator, you will find 22 rules, which, according to Bollinger, were compiled in response to questions and years of traders’ experience and should serve as a starting point for those who are beginning with this indicator. Among the most important ones are the reminders that the upper band, or its touch or crossing, is certainly not a sell signal per se and that touching or crossing the lower band is not a signal to open a long position. In strong trends, the price will typically cross the upper or lower band several times in succession, and a close above the upper band or below the lower band should be taken as a continuation signal.
As periods of low volatility alternate with periods of higher volatility, it is important to monitor this indicator, especially when the space between the bands narrows (called a squeeze). This is precisely the period when volatility is falling, and a more pronounced trend movement in one direction or the other is likely to follow. It is then that a break of one of the bands can signal the start of a new trend.
Bollinger Bands work best as a complement, either to the price action itself, where it can assist the trader in deciding on more accurate entries (Bollinger itself lists double top or double bottom formations, for example) or to another indicator. The key to combining it with another indicator is that the two tools are not correlated and are based on different types of data. According to Bollinger, these can be, for example, MACD, On-balance Volume, or RSI.
Bollinger Bands can be a good tool for traders on different time frames and for different investment instruments. However, as with other similar indicators, it is not a self-contained tool that any trader can make wonders with.


- As many Free Trials as you need
- Up to $200,000 account
- No time limit

Worldwide Reviews