Technical Analysis - Moving Average Convergence/Divergence
The MACD (Moving Average Convergence/Divergence) indicator is an indicator that combines features of a trend indicator and a momentum oscillator. This makes its use quite wide and today, we will look at a few ways to work with this indicator.
The MACD indicator shows us the relationship between two exponential moving averages for a selected instrument. In the basic setup, the MACD can be calculated by subtracting the longer moving average with a period of 26 (EMA 26) from the shorter moving average with a period of 12 (EMA 12). The reason why the exponential moving average is used for its calculation is that this type of moving average assigns more weight to recent prices.
The signal line then forms a simple moving average of the MACD indicator with a period of 9 (SMA9) and can act as a trigger for buy and sell signals.
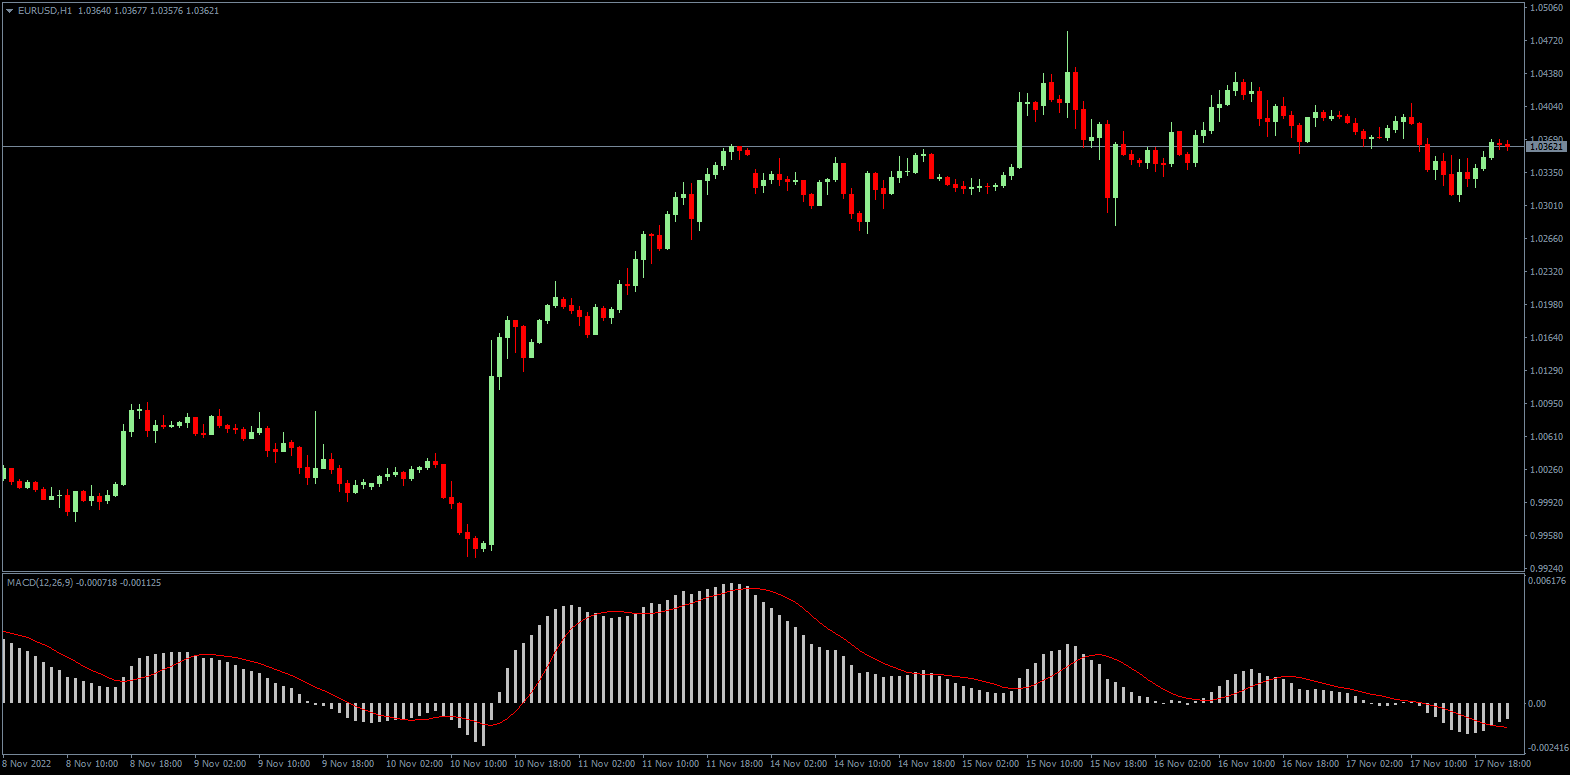
The MACD is displayed in basic form as a histogram, which is above the zero line when the EMA 12 is above the EMA 26. When EMA 26 is above EMA 12, the histogram is below the zero line.

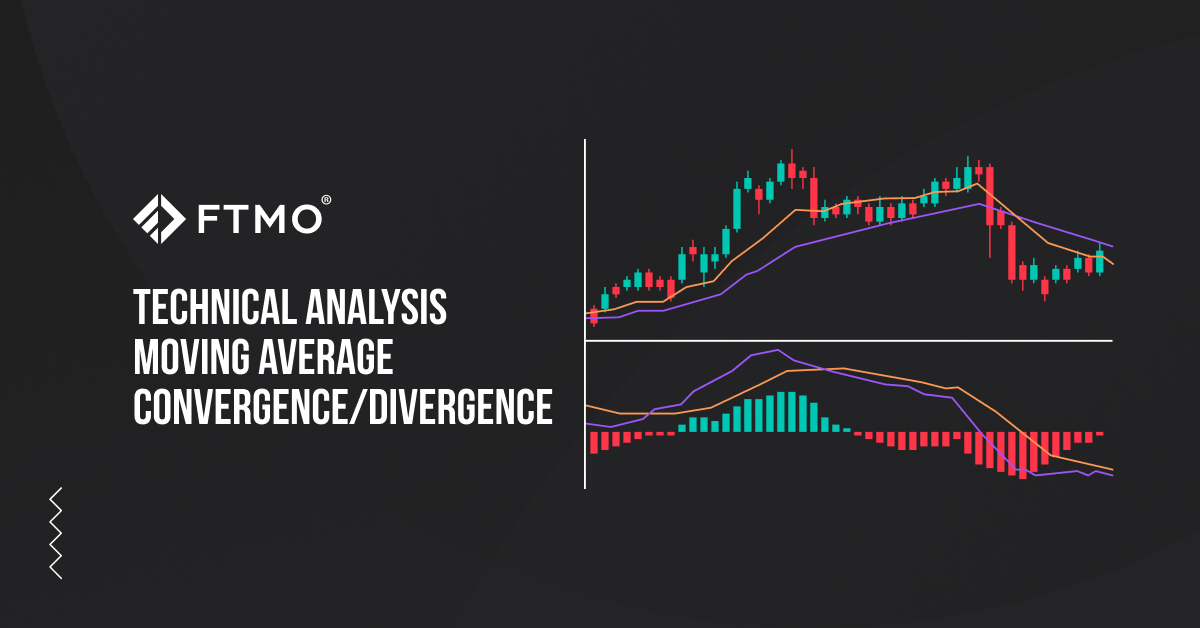
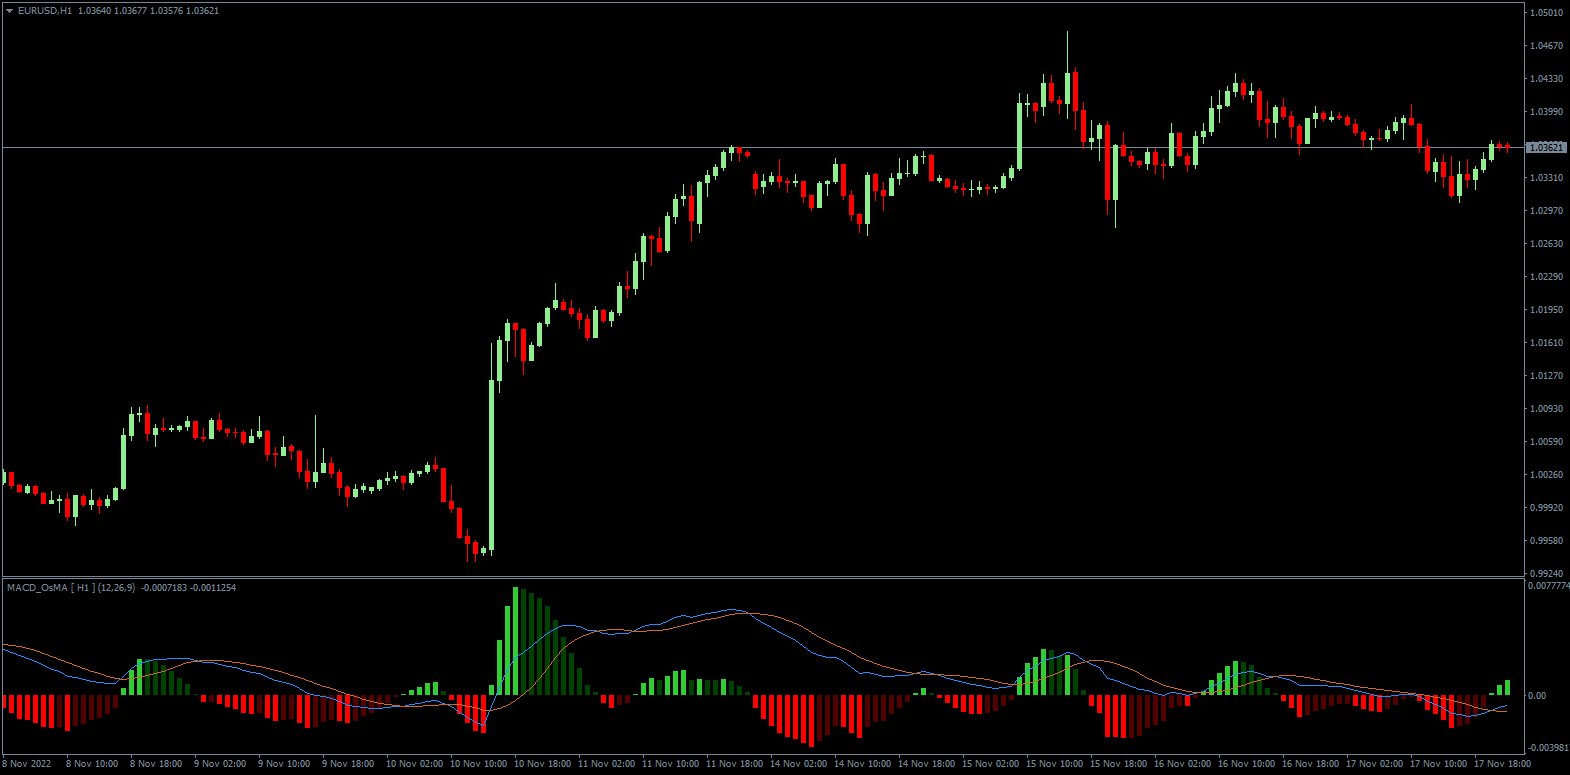
However, a much more popular display is with two lines and a histogram, where the MACD line is displayed instead of the basic histogram. The histogram is then above the zero line when the MACD is above the signal line. On contrary, it is below the zero line when the MACD is below the signal line. At the same time, the histogram shows the distance between the MACD and the signal line.

Although MACD is displayed similarly to some oscillators (Stochastic Oscillator, William's Percent Range, RSI) in an off-chart window, it is not a classic oscillator but a combination of a trend indicator and an oscillator showing the momentum. This means that it can provide interesting signals on emerging trends with strong momentum, but it does not point out oversold or overbought markets.
Crossover
MACD as an indicator gives delayed signals because it is based on historical data, which needs to be taken into account. Investors mostly use MACD as a trend indicator when there is a crossover appearing. In the first case, it is a crossing of the MACD and the signal line. When MACD gets above the signal line, it is a buy signal (long position), when MACD gets below the signal line, it is a sell signal (short position).
In the second case, it is a crossing of the MACD and the zero line, i.e. when the MACD falls below the zero line, it is a sell signal, when the MACD gets above the zero line, it is a buy signal. In both cases here the MACD acts as an indicator of strong trends, but in side-moving markets, it can give false signals.
Divergence
Another popular use of the MACD is to look for divergence, which occurs when a high or low is formed on the MACD, but no new high or low is formed on the price chart. Thus, price forms new extremes, but market momentum is already fading. Therefore, when new lower low forms on the price, but a new low does not form on the MACD (a higher low forms), it indicates a weakening of the strength of the downtrend and a possible reversal to the upside, i.e. a buy signal.
On the other hand, when a new high forms on the price but a lower high forms on the MACD, it is a sell signal. In both cases, it is also good to watch the long-term trend, as divergence signals act more as a confirmation of a longer trend, not as an indicator of a trend change.
MACD Hook
Another way to take advantage of the MACD line is called the Hook. This is formed when the signal line approaches the MACD line but does not cross it. This signal indicates a correction within a longer trend and can serve traders as a useful tool for confirming the trend and entering additional positions after corrections.
There are many other ways to use the MACD indicator in trading. As with other indicators, the MACD should be used in combination with price action or other technical analysis tools to make signal confirmation more certain.
About FTMO
FTMO developed a 2-step Evaluation Process to find trading talents. Upon successful completion you can get an FTMO Account with a balance of up to $200,000. How does it work?.


