Modern Prop Trading — Since 2015
Grow & Monetize
Your Demo Trading
Improve your trading skills on our simulated platform and earn rewards
- Up to $200,000 FTMO Account
- Support in 20 Languages
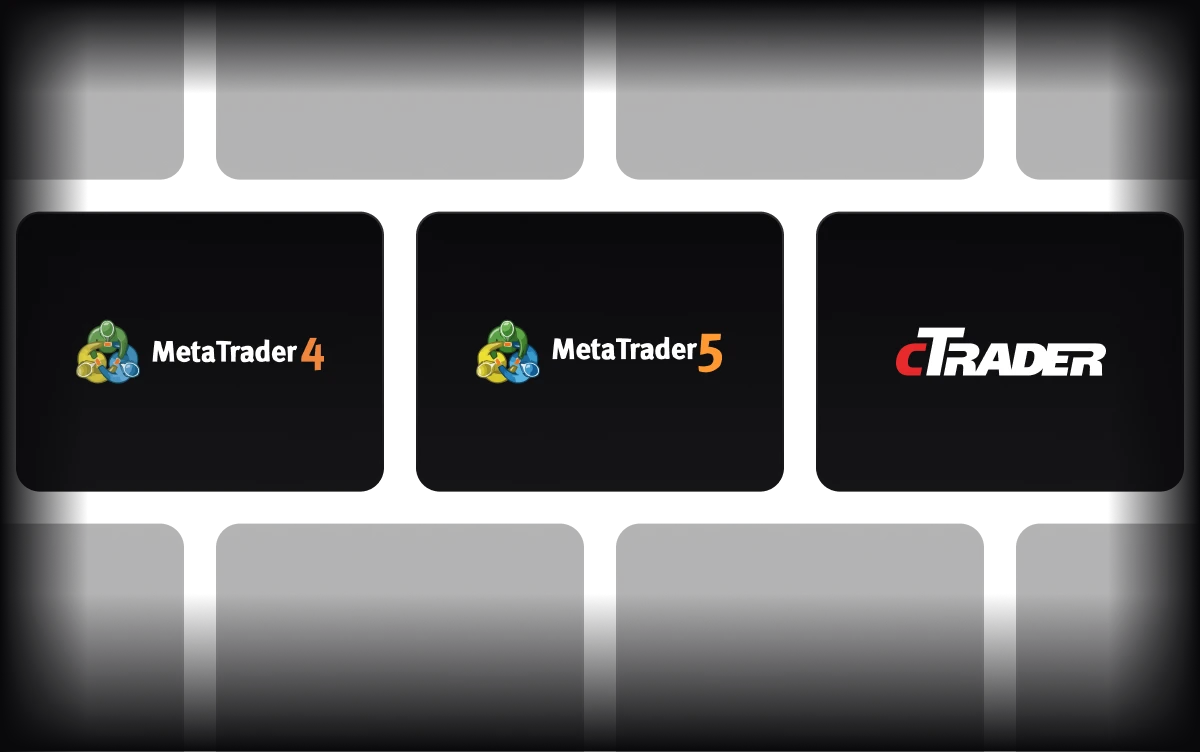
- 3 Trading Platforms