


Weekly, Daily and Monthly Open Trading Strategy – An easy way to follow trends
Can one single line that is drawn every week at the same time have any use in trading? The weekly open gives us a straightforward idea of any given market standing for the trading week. How exactly can you utilize it in your trading? Let’s find out!
Weekly open trading strategy
A lot of traders spend their weekends doing market analysis, and they often come up with different ideas and price predictions for an upcoming trading week. If you are bullish or bearish on any given instrument, price rarely goes up or down in a straight line.
That is why you can implement a weekly open strategy in your trading.

We are sure that you are well aware of this image. The anatomy of a candlestick chart is no mystery for every trader.
In this case, the upper and lower wicks are very important. The idea behind using the weekly open is the fact that even in up weeks, the price usually trades lower first, and it is seen as a wick on a weekly candle.
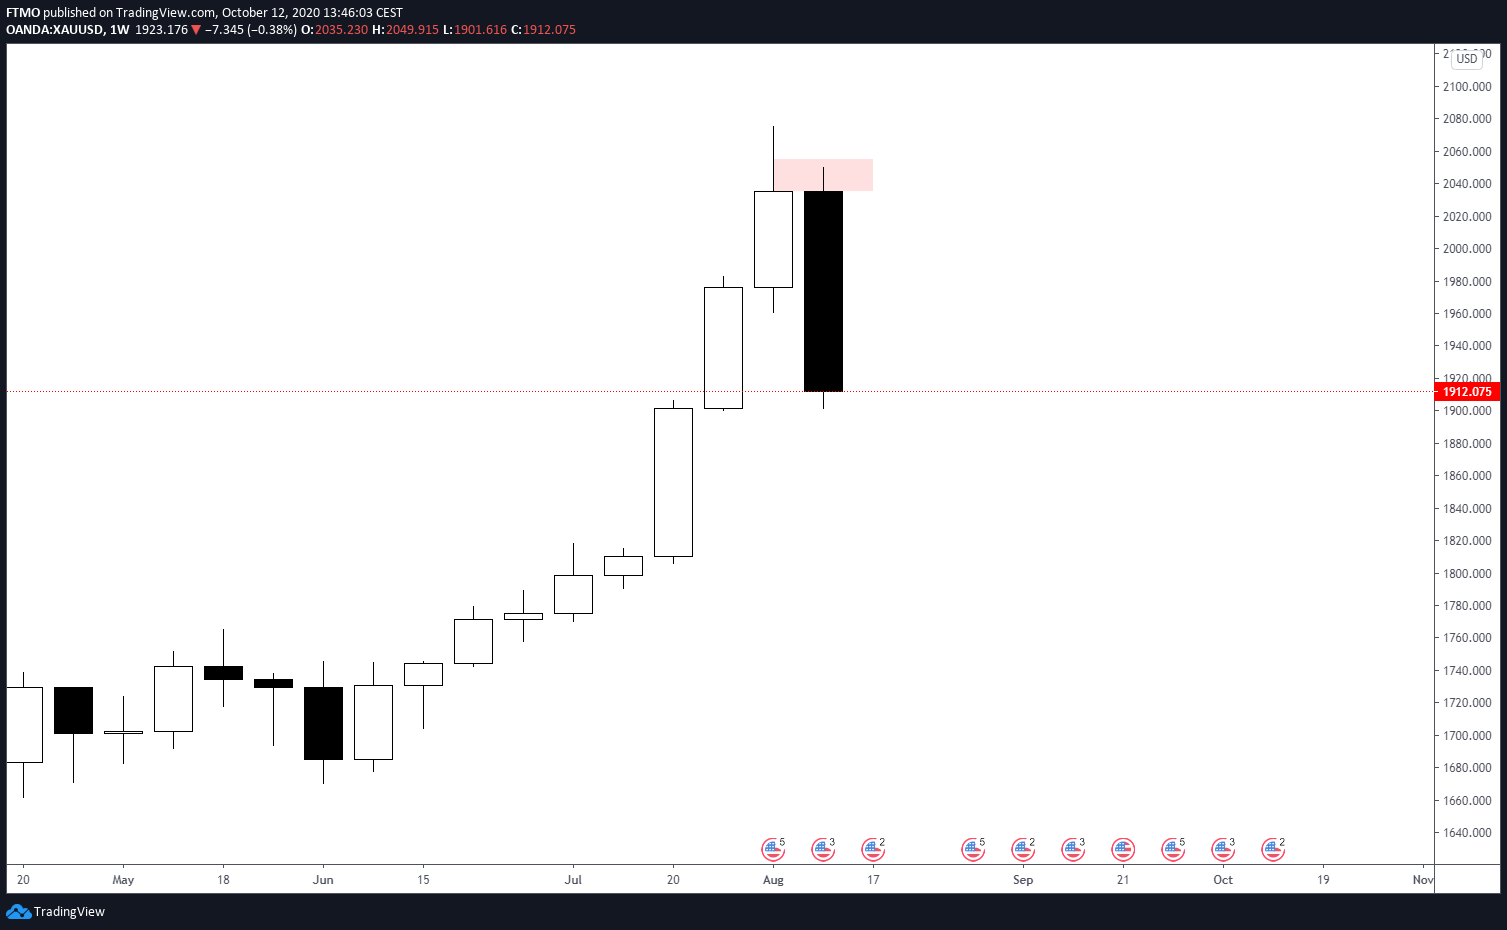
Looking at this chart of Gold, you can see that on a big down week, the price traded higher after the open first. This eventually left the wick above the body.
If we are going to mark out the weekly open line and go to lower timeframes, you can see what exactly happened.
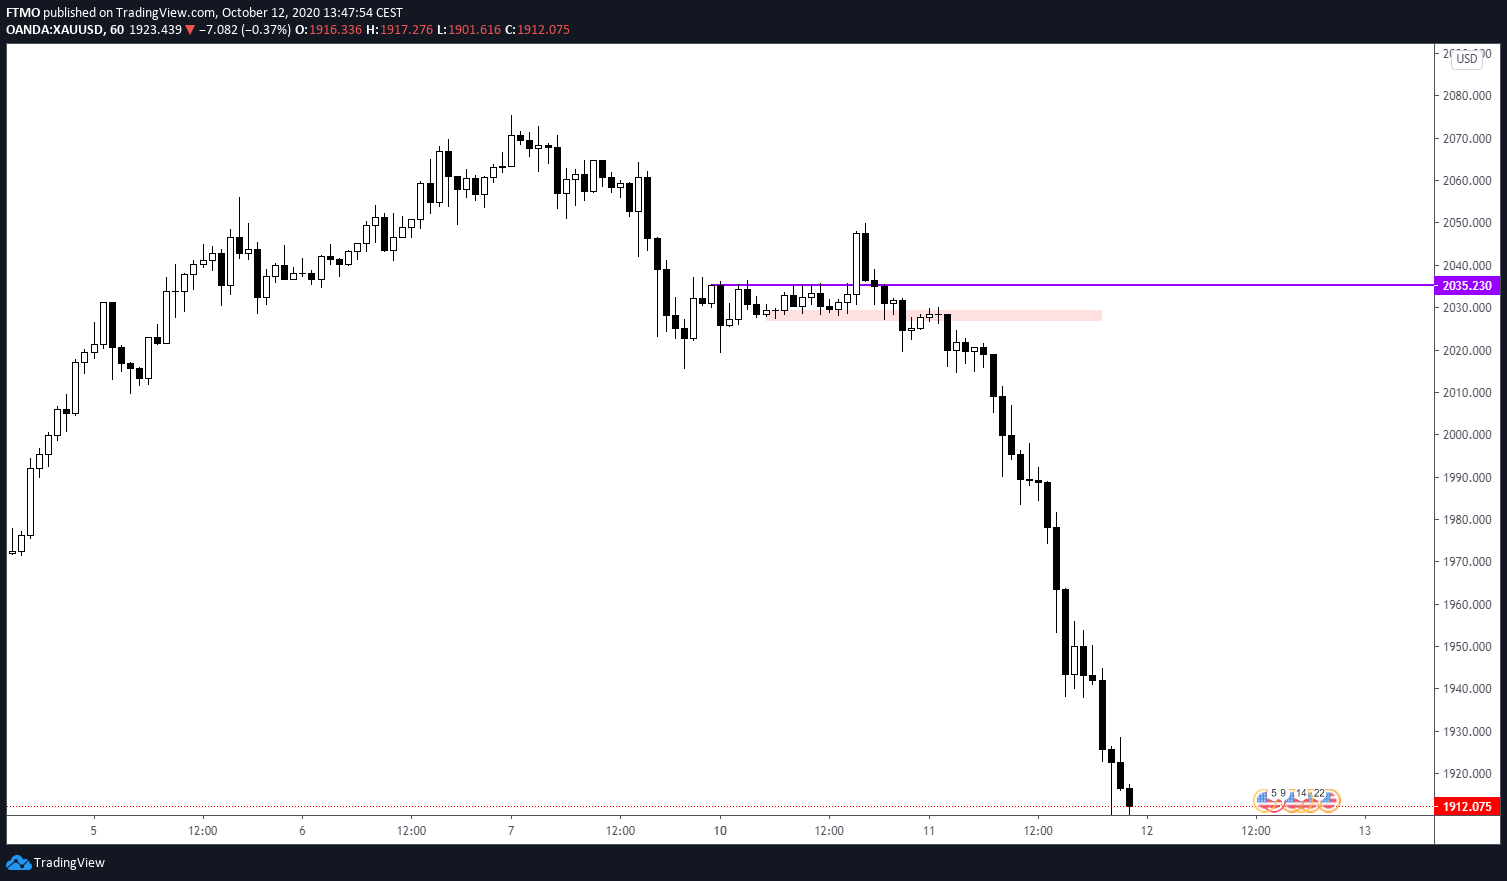
On the hourly timeframe, you can see the weekly open line marked out with a purple horizontal line.
The market tried to push above first, but as it failed and then previous level of support turned to resistance, we got a good short entry in line with the weekly open level.
The weekly open is not a stand-alone strategy, but more of a tool of confluence that gives us a great idea where we are standing with the higher timeframe trend.
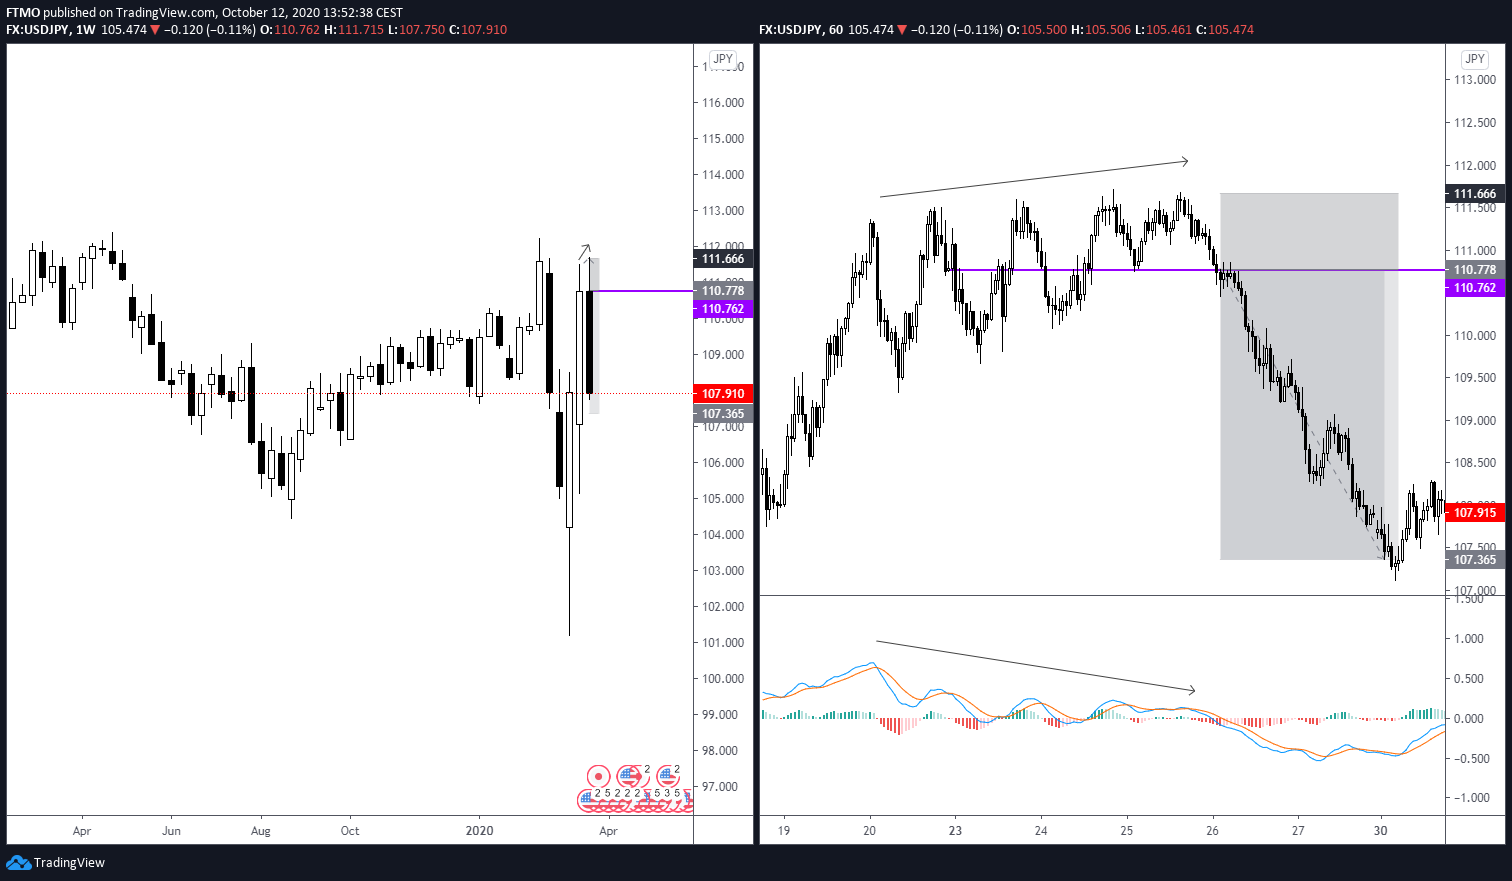
On this USDJPY example, you can notice how the price pivoted around weekly open line first.
The MACD divergence at the highs was signalling a potential selloff the whole time.
Once the market shook out all the early shorts, we sold off. The weekly open line could once again be used as the trade entry.

Daily open
The same idea can be used on a daily open. Either you have a plan for the upcoming day or not.
Daily open level gives you an idea who is in control for the day. This level very often acts as strong support or resistance.
All you have to do is simply to mark out daily open with the horizontal line and watch market acting around the level.
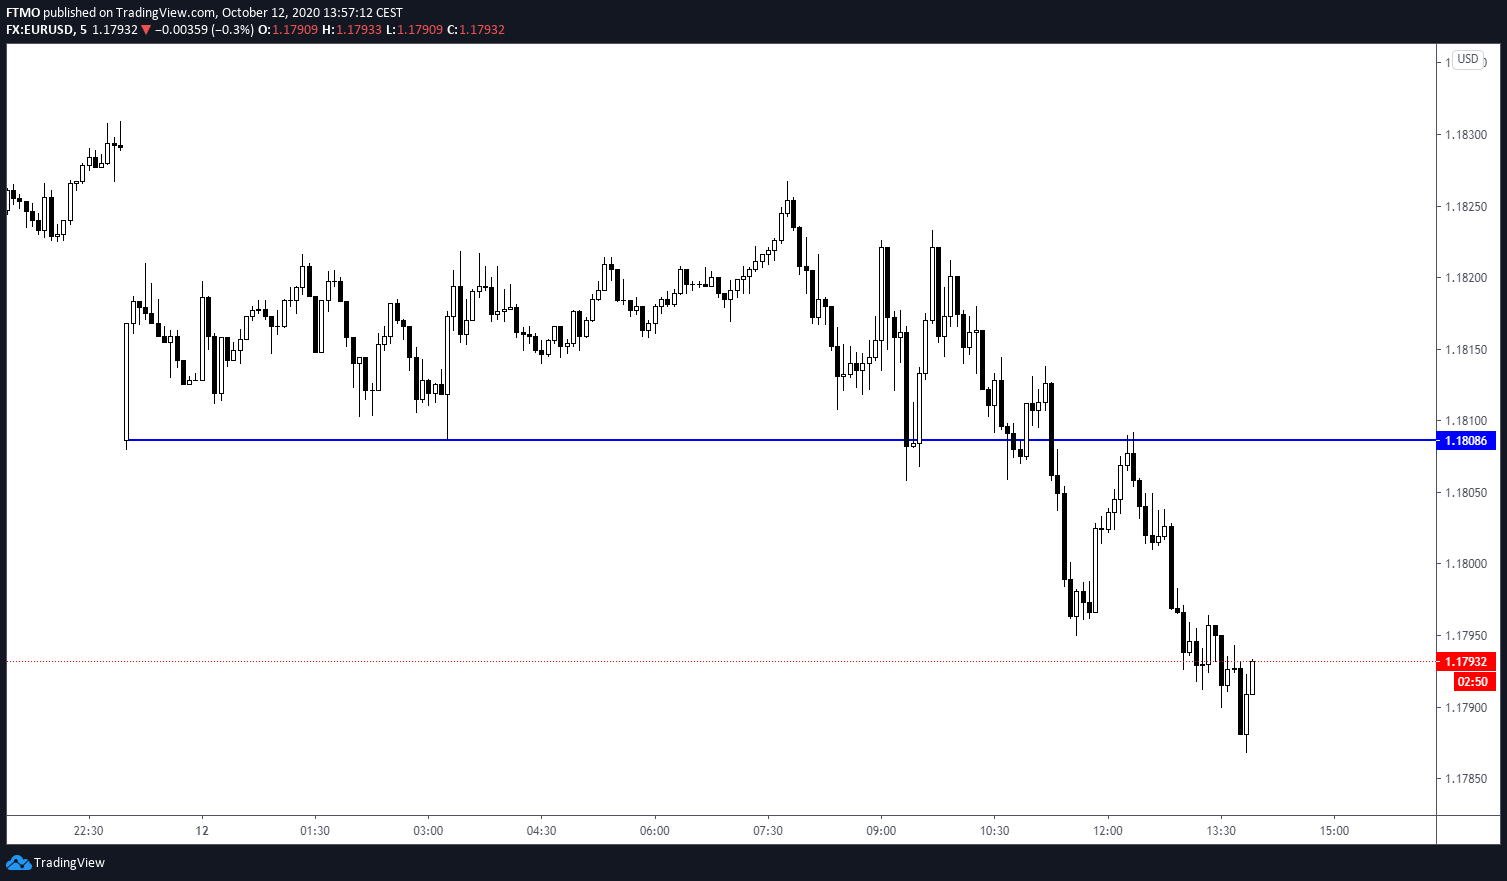
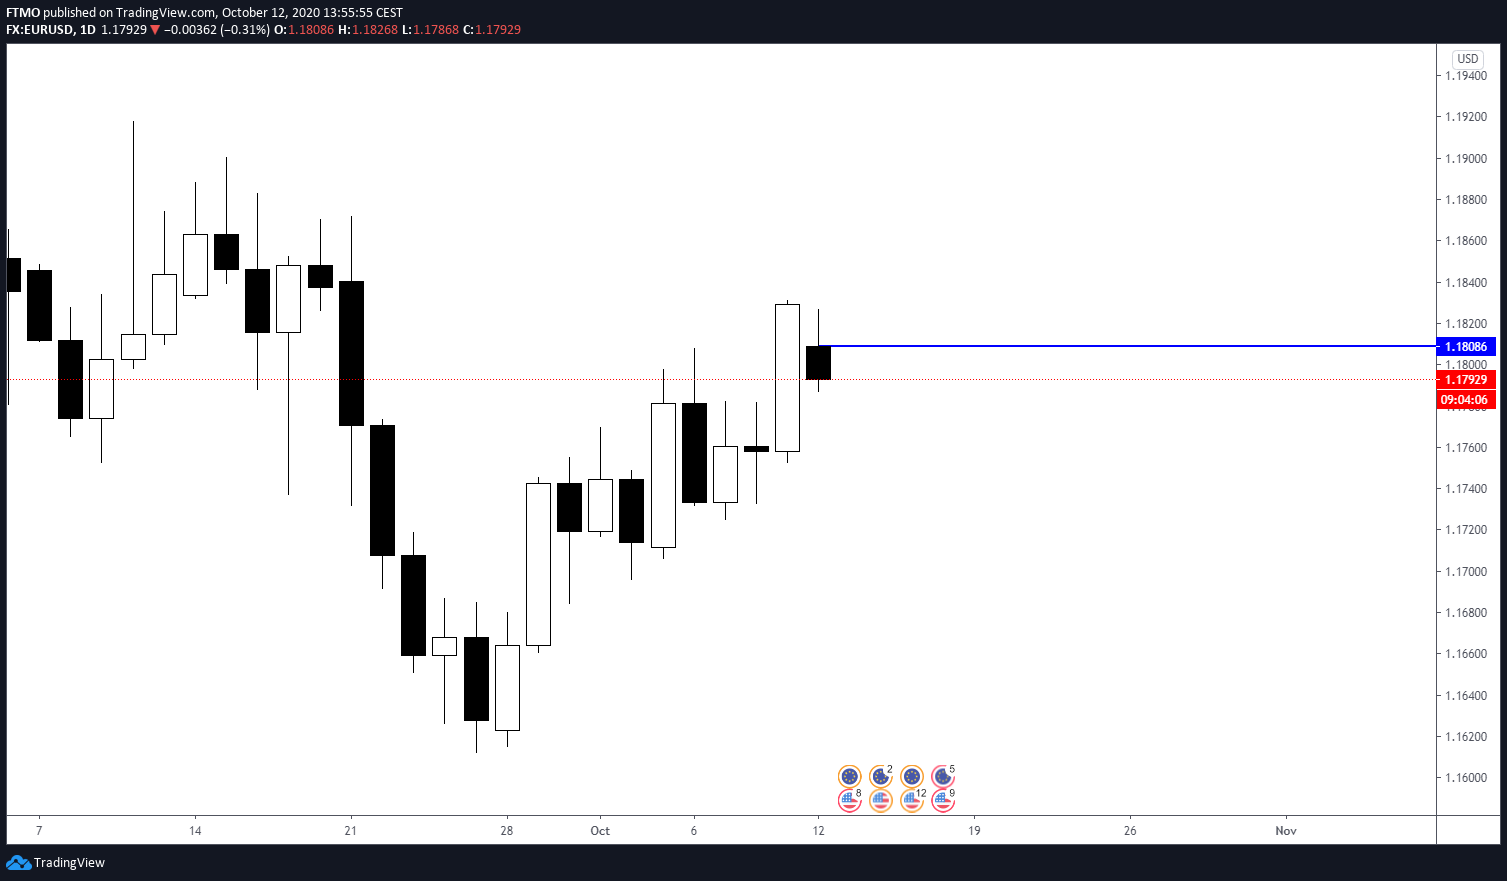
This EURUSD is really a perfect example, the market held the daily open as support first, but once we filled the gap and successfully broke below the daily open, good short entry presented itself on the retest.

Monthly Open Trading
Last popular open level can be found on a monthly chart. This one really gives you an easy overview of direction for the whole month without looking at a monthly chart.
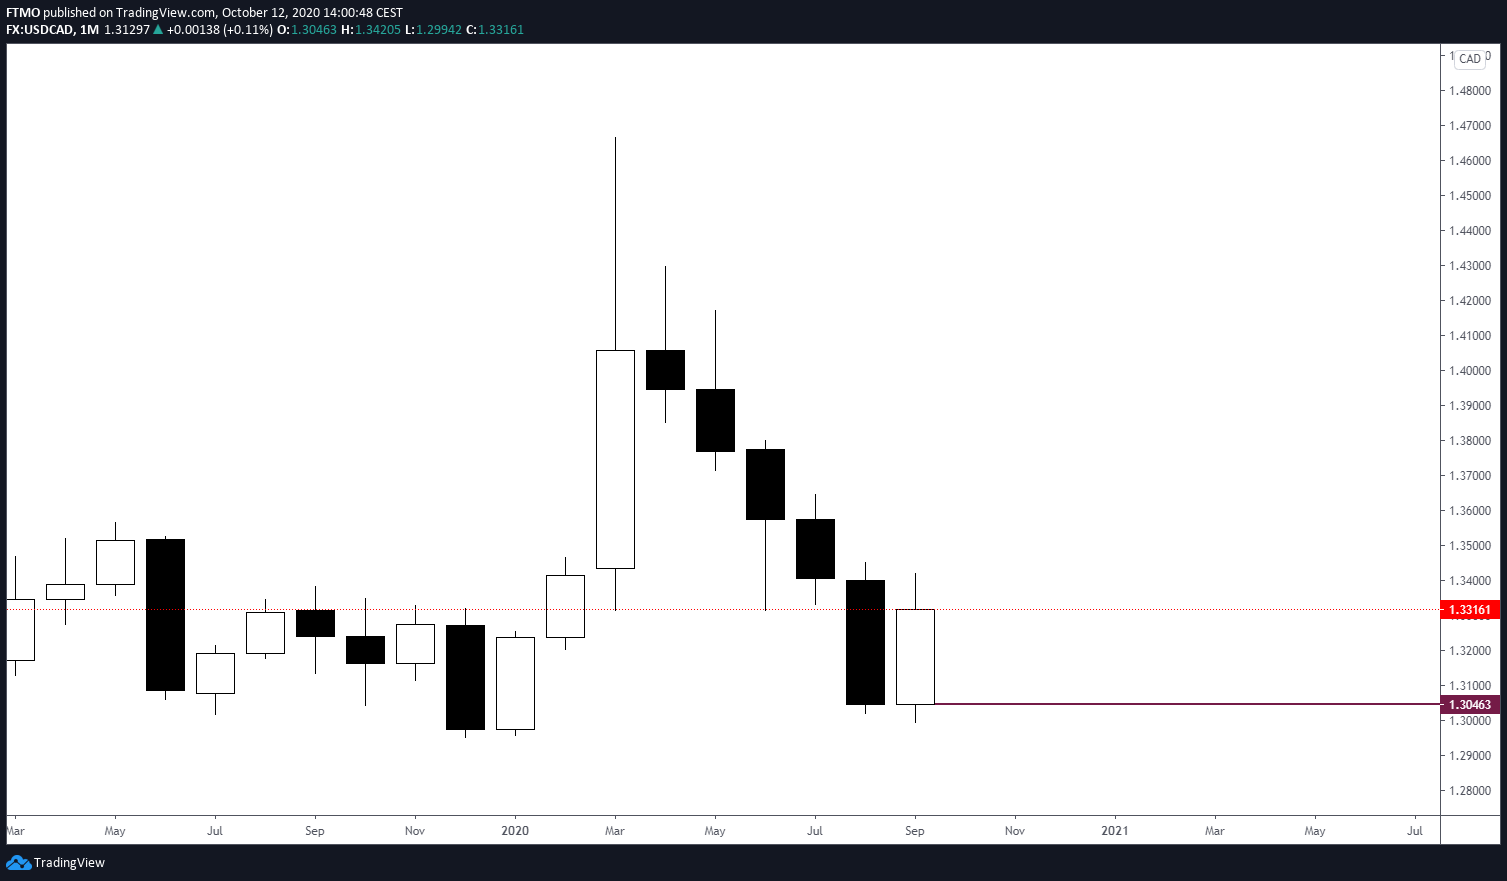
The example shows USDCAD with a strong monthly trend.
But before we moved higher, the market traded below the previous month low to shake-out longs that were too early for the move and placed their stop below previous month low.
Did the market respect the monthly open level? You bet it did!
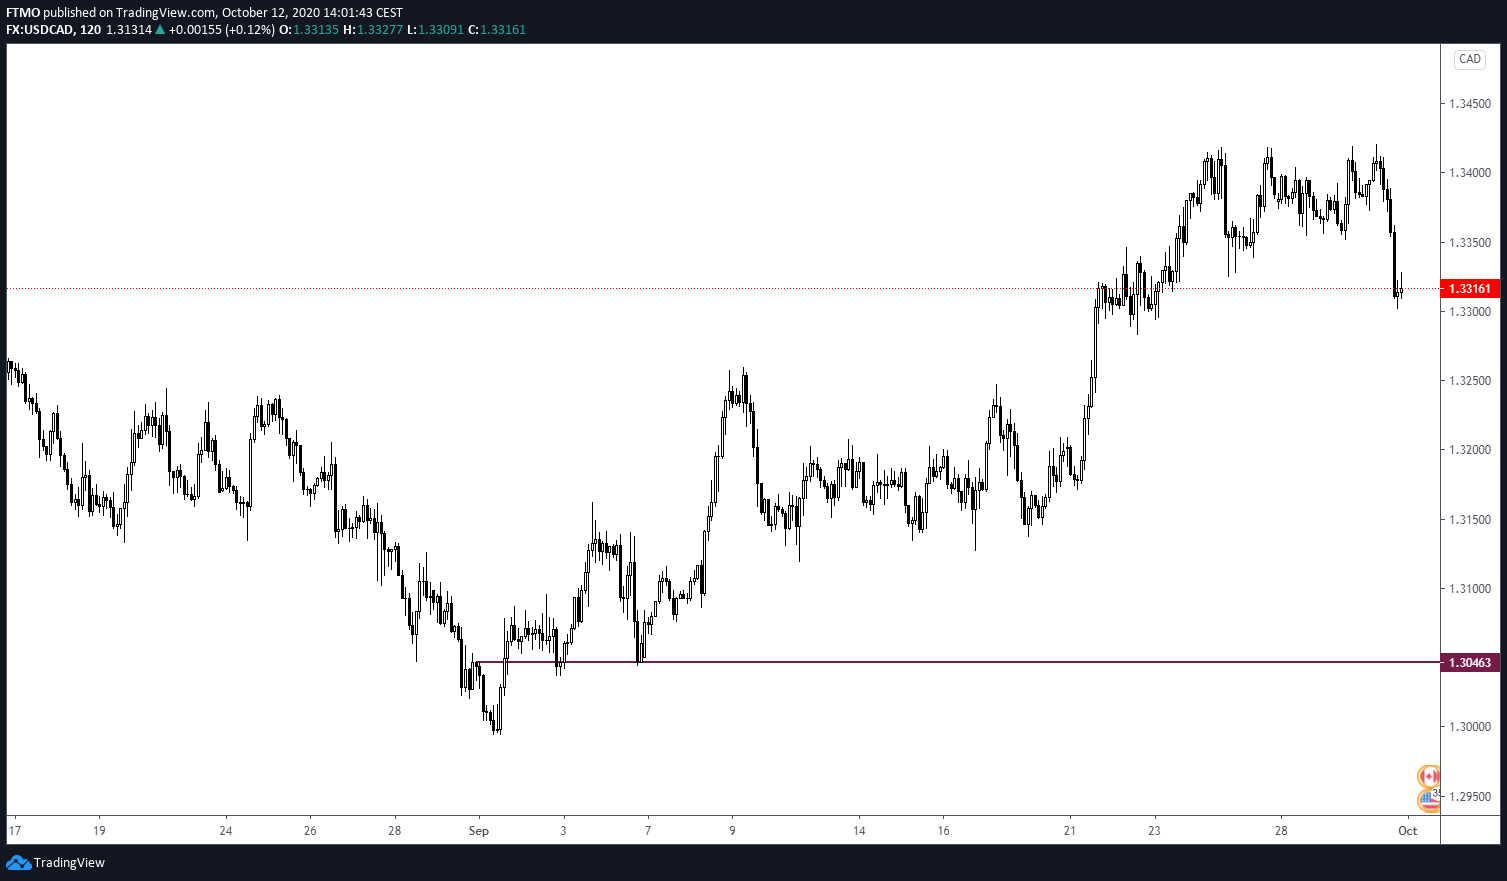
As you can see, the price broke above 1.30463 monthly open level and tested it twice before the big rally higher.
In Conclusion
As we already mentioned, Monthly, Weekly and Daily open levels are not a stand-alone strategy, but they can be used as great confluence levels for your ideas.
Because of their simplicity and the fact they can be marked in a matter of a few seconds, they can be a useful tool for every technical trader.


Related


Popular On FTMO


- As many Free Trials as you need
- Up to $200,000 account
- No time limit

Worldwide Reviews