


FX Blue App Suite - take your MT trading to the next level
As part of our never-ending quest to expand services and tools for FTMO clients, we bring you an exclusive suite of tools for the MetaTrader 4 and MetaTrader 5 platforms from FX Blue. They are designed for anyone who has embraced MetaTrader and at the same time wants to have access to the most sophisticated tools available to traders today.
What is the App Suite from FX Blue
The App Suite is a comprehensive suite of over 35 advanced trading tools developed by FX Blue. It includes some very useful and advanced tools and features, from sophisticated charting and calculators to manage risk, to real-time sentiment analysis, and advanced trade execution features.
The collaboration between FX Blue and FTMO has resulted in this suite of tools being tailored specifically to the requirements of FTMO Traders and FTMO clients. This makes these tools available to all registered FTMO clients who have any account with us, including Free Trial accounts, and use the Windows operating system.
Whether you're here to streamline your trading, manage risk more effectively or gain deeper market insight, the FX Blue App Suite provides a seamless and intuitive solution - all integrated directly within the MetaTrader platform.
Installation
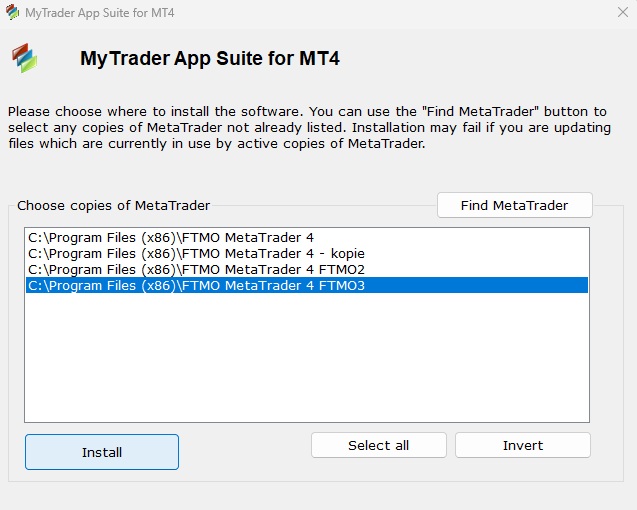
You can download the installation file in your Client Area under Downloads, where you will find the .exe files for MT4 and MT5 platforms, so download the version depending on which platform version you are using and start the installation. Right at the start, the installation wizard will ask you which application you want to install the App Suite into. If you have more than one MT4/MT5 installation on your PC, you choose which one you want to install the App Suite into and click the Install button. You can install the App Suite on all versions of MT4/MT5.
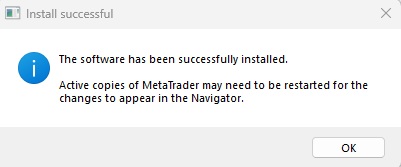
If you have a particular version of MT4/MT5 just running, you will need to restart it.
Once the platform is open, you will then find the App Suite tools in the Navigator in the Expert Advisors panel under the name MyTrader app suite.

Since there are dozens of tools included in the App Suite, they are divided into several groups according to their functionality and focus for better orientation.
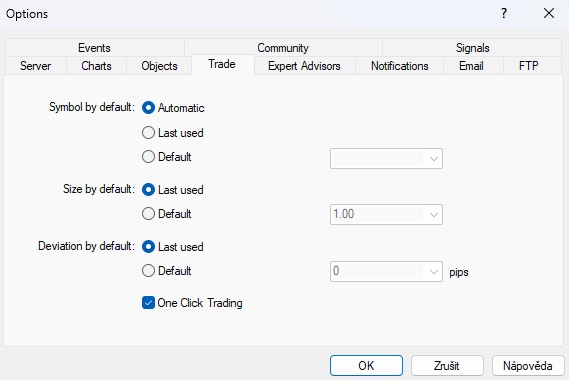
It is important to mention that before you start using the chart and want to enter trades directly in it, you need to have One-Click Trading set up (in the Tools - Options - Trade window), which you need to confirm afterwards.
You also need to check the Allow automated trading, Allow DLL imports and Allow WebRequest for listed URL checkboxes in the Tools- Options - Expert Advisors window.
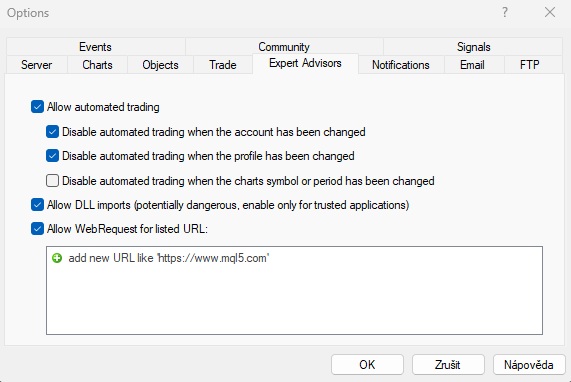
If you set it up after you use the new chart, it is possible that it will throw you the message "Automated trading is disabled in the back-end plarform which services the platform". You will then need to restart the platform again.
To launch the selected application you need to double click on it or drag it to the selected window that is currently open. A classic window will appear where you can edit the settings and after confirming this by clicking OK, the application will be launched in that window.

If you then want to close the application in that window, just double-click on it again. A window opens, confirming that the application has been stopped and that it will be replaced by another application (in this case, the same one).
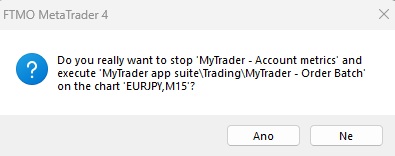 The confirmation window will appear again, but in this case just click on the Cancel button and the app will disappear from the window. The individual apps in that chart window are then changed in a similar way (the stop window and then the confirmation window).
What App Suite offers
The App Suite provides traders with a large number of different extensions and applications, including enhancements to the existing MT4/MT5 platform environment. This solution has the potential to change the minds of many of the current critics of the MT4/MT5 platforms who, for various reasons, decide to switch to another platform. App Suite can certainly change this decision.
Automation
As already mentioned, for better clarity, the App Suite is divided into five parts according to the focus of each application. The Automation section focuses on automated trading and alert setting options.
Alarm Manager allows you to set up custom alerts and automated orders. Trader here has at his disposal:
- Options to set custom alerts for real-time market and account changes,
- Setting automatic trades based on price, margin or indicators,
- Alerts via email, Twitter or SMS for instant updates,
- setting up activations via RSI, MACD, Bollinger bands, etc.
Excel RTD allows you to transfer real-time account status, price and trade data directly into Excel, without the use of macros or advanced programming. You can also use this application to open and close trades directly from Excel and optimize processes using VBA commands, or link multiple accounts to consolidate data and get a comprehensive view of the market.
Calculators
This section offers several calculators that allow traders to improve risk management and have maximum control over their position sizes.
Combined Calculator offers several of the most important calculators in one window. The trader is thus able to calculate in one window the pip value, margin, profit and loss, SL and TP, position size or pivots, Fibonacci levels, and the conversion rate of each currency pair. If a trader uses only one of the above calculators, he can select the one he wants to use in a separate window.

Currency Converter allows real-time conversion between currencies based on live rates.
Fibonacci Calculator allows you to calculate Fibonacci retracement and extension levels based on given price levels.
Margin Calculator calculates the required margin for a given instrument based on position size and leverage.
Pip Calculator calculates the pip size in a given currency for a given instrument based on the position size.
Pivot Calculator can calculate pivot point, support and resistance values for up to four types of pivot points (classic, Woodie, Fibonacci, Camarilla).
Position Size Calculator calculates the position size based on parameters that correspond to the defined risk per trade.
The Profit Calculator allows you to find out the size of the possible profit for a given instrument based on the position size of the opening and closing price in a given currency and in pips.
The SL & TP Calculator will then help to set the desired SL and TP levels for the selected instrument in a given currency based on detailed parameters.
Market Data
The Market Data section is the largest and probably the most interesting portion of applications.
The Chart (new chart window) offers, besides a completely different view, also a better risk management before entering a trade and a number of additional functions that are available to traders along with the original functions offered by the regular MetaTrader environment.
The Correlation Matrix displays the level of correlation between major pairs, which will help the trader in managing the risk of his trading strategy. The trader can specify the time period or timeframe to be monitored, and can also check the correlation between selected (two or more) pairs.
Currency Heat Map allows the trader to track the performance of currency pairs over the last 24 hours, ranked from the most profitable to those that have experienced the biggest drop. It also allows you to track the performance of the selected currency against other currencies.
Currency Strength tracks the relative strength of each of the most traded currencies, gold and bitcoin. This allows the trader to see the strongest and weakest instruments within the selected timeframe as well as within individual timeframes.
The Future event scanner tracks potential highs and lows with potential breakouts, as well as crossovers and potential trend changes in the markets. It highlights markets with a strong trend or moving in a range, while the trader can adjust the scanner parameters and filter events according to his trading style.

The Market List shows details of all investment instruments offered, including contract and pip size, minimum and maximum position size or swap size. The trader can sort instruments by asset class (stocks, commodities, forex, indices, etc.), and also by the underlying currency or asset.
Market Ranges tracks price action versus volatility in selected markets. A trader can monitor the volatility of a selected instrument from 1 hour to 48 hours and manage the risk in their trades more effectively accordingly.
Market Scanner allows you to track the evolution of selected instruments from a few selected technical analysis tools. The trader can choose which markets to monitor, which indicators to use and on which time frames, giving him a comprehensive view of the markets while focusing on erspective trading opportunities.
Minicharts will display multiple charts of selected instruments in one window according to the trader's preferences. Of course, customization of timeframes, chart styles and technical indicators is a matter of course.
Sentiment gives the trader insight into what percentage of real accounts hold long and short positions on each instrument. The trader can choose to view in columns or scale, by instrument or by currency.
Tabbed Charts allows you to open multiple tabs within a single chart window with individual instruments to switch between, just as you can in the classic MetaTrader view. This will make switching between charts in FXBlue easier.
Technical Analysis offers a comprehensive view of the selected market through several technical indicators while providing a percentage score of the instrument's suitability for buying or selling. Again, the trader has the ability to customize time frames and select individual instruments.
News
In this section the trader has access to several fundamental analysis tools.
Calendar offers a classic calendar view, but again the trader can customize it according to the importance of the time zone events or the selected currencies he wants to have available.
Price Action News offers the trader to monitor important alerts on highs, lows, changes in momentum and changes in sentiment in the markets.
Session Map then displays a map highlighting each trading session, including the current one, while still adding the most important macroeconomic news for each session.
Trading
The trading section focuses on the trading of the trader or client.
Account History shows really detailed information about how the trader has traded, which can help in analyzing his performance.
Account Metrics offers a view of the open trade, including information about the size of the margin used, the floating P/L of the current profit/loss of free margin, etc.
Order Batch offers the ability to set up multiple orders to be placed at once with one click and use the set actions for all markets simultaneously or individually.
Order Grid allows you to efficiently manage multiple positions by creating a series of pending orders on a customized base order. This allows the trader to influence the spacing, volume and direction of orders to suit his trading strategy.
The Quote Board displays the selected instruments and allows them to manage, open or close trades efficiently. Here again, the trader has a large choice of settings for displaying and executing orders, which again increases his efficiency.
The Trade List shows open positions and pending orders and again allows for their easy management with individual display settings and various filters.
Container
Under this strange name is a tool that allows the trader to almost completely personalize the environment in which he can determine which tools he will use and what their layout will be. It also allows you to efficiently edit layouts, link widgets and synchronize market data and timeframes, and seamlessly switch between saved configurations for efficient navigation.

This article is for informational purposes only, and some information may not reflect the current service offering or product features. Please always verify the latest terms on the official product pages. All information provided herein is intended solely for educational purposes related to trading on financial markets and does not constitute investment advice or serve in any way as a specific investment recommendation. Please read the full disclosure here.
About FTMO
FTMO has developed an evaluation process to find trading talents. Upon successful completion, you may be eligible for an FTMO Account with a balance of up to $200,000 in simulated funds. How does it work?