Economic calendar – why housing market data is so important
The housing market is quite an important part of the economy. In developed countries, real estate and home ownership represent a substantial part of household wealth. Data from the housing market is thus an important part of the overall picture of the state of a country's economy for economists and investors.
Investing in housing is one of the largest lifetime investments for most people, and owning a house is therefore a large part of household wealth. Housing construction is also an important sector of the economy and contributes a significant share of GDP in each country.
Effect on GDP
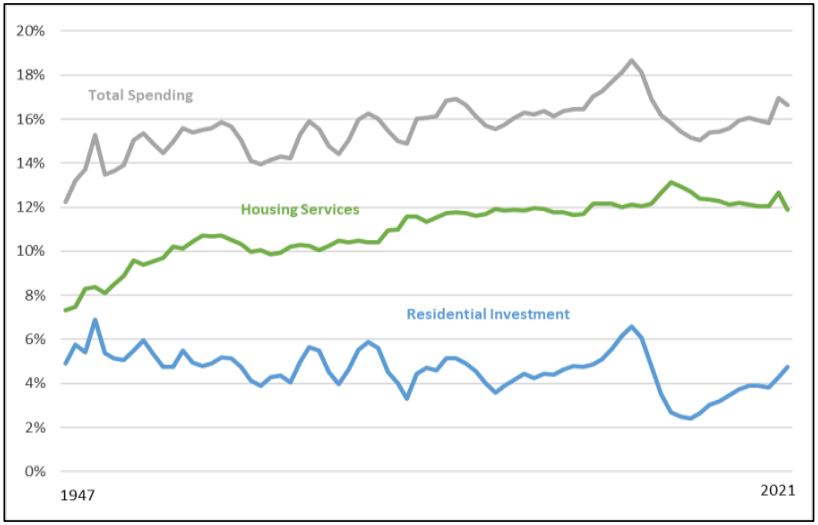
For example, in the US, spending on the construction and reconstruction of housing and residential buildings, including fees and taxes, accounts for around 5% (4.8% in 2021) of total GDP. Spending on housing-related services, including rental and utilities, accounts for nearly 12% of GDP (11.9% in 2021). The housing market therefore accounts for nearly 17% of GDP in the US, having accounted for nearly 19% of GDP at its peak in 2005.

Source: Congressional Research Service
Effect on the labour market
Housing construction also has a relatively significant impact on the labour market. After its peak in 2006, the sector employed over 1 million people. This number almost halved after the housing bubble burst (560,000 people in 2011), but employment in the sector has been growing again in recent years (903,000 people at the end of 2022).
The impact of the housing market on the economy and the financial markets was very evident between 2007 and 2009, when the aforementioned bubble burst and the subsequent recession hit the US. In this case we could also see how house prices can influence the overall economic growth. Higher house prices lead to increased investment in housing, but they also encourage homeowners to spend more in other areas of the economy. A fall in house prices can then have the opposite effect.
At the same time, it was evident how the housing market can act as a leading indicator, as it had already peaked in 2005. Since this market is very illiquid and each house or apartment has only a limited number of potential buyers, its growth, and especially its declines, take place over months, not days or hours.
Housing market indicators
Investors and economists may therefore consider the housing market as one of the main indicators of the state of economic development in the country. Several basic indicators are available to assess the state of the housing market. Building Permits, Housing Starts, and Homes Sales are among the main leading indicators of the housing market's condition.
Building Permits
Building permits are issued by local authorities for any construction projects for new residential or commercial buildings. Interestingly, not all parts of the US require a building permit. Building permits are a good indicator of the growth or decline of construction activity and thus the state of the economy in a given area. Growth indicates an increasing demand for new housing, which may indicate possible economic growth and job growth.
Housing Starts
Housing Starts show the number of new housing starts and how they have changed over the last month. This is an indicator that gives a fairly good picture of the change in housing demand. Of course, growth means that demand for housing is increasing, the construction sector is thriving and again this can have a positive effect on employment and economic activity in the area.
Home Sales
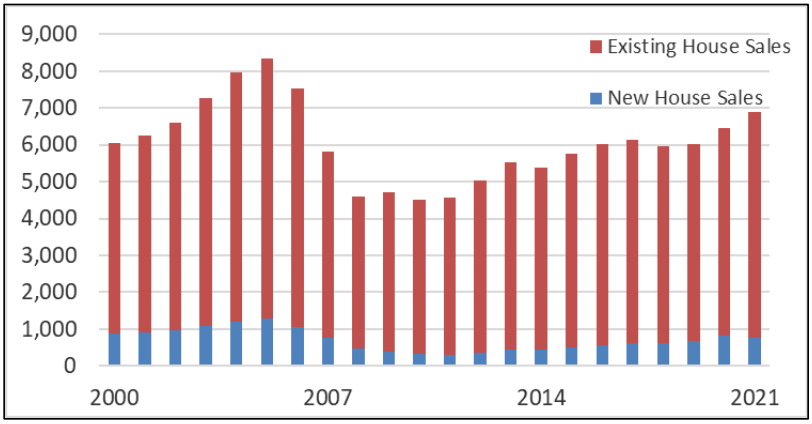
Several numbers are tracked for home sales. As expected, these are again numbers whose growth points to a strong economy and people's willingness to buy real estate, which is usually a relatively large investment. New Home Sales are also associated with a possible increase in demand for new appliances, furniture, and other household goods, again indicating positive changes in the economy. New Home Sales statistics are also monitored by developers, who can make longer-term decisions about investments, pricing, and new projects accordingly.

Source: Congressional Research Service
The strength of the real estate market is also shown by Existing Home Sales, which is the number of existing residential buildings that changed hands in a given month. It is published by the National Association of Realtors (NAR) and is the number of completed transactions, the increase in which may indicate a rise in consumer confidence. Unfinished transactions and their change over the month are then shown by the Pending Home Sales figure, which is also published by the NAR and has a similar effect on the economy.
Other indicators that track the housing market in the macroeconomic calendar include the NAHB Housing Market Index (which measures sentiment among homebuilders regarding current and future sales and traffic of single-family homes) and the House Price Index (HPI), which measures the monthly or quarterly change in residential real estate prices.
About FTMO
FTMO developed a 2-step Evaluation Process to find trading talents. Upon successful completion you can get an FTMO Account with a balance of up to $200,000. How does it work?.


