


Why Your Backtest Is Lying to You

You tested your strategy. The backtest came back with a 72% win rate and an RRR of 1.5. The equity curve climbed smoothly from left to right. Then you started trading it, and the results looked nothing like the report. Here is why that happens and five simple tests that would have warned you in advance.
Those Numbers Were Too Good to Be True
Start with the two figures themselves.
A 72% win rate at 1.5 risk-reward means that out of 100 trades you win 72 and make 1.5 times your risk on each, and you lose 28 at 1 times your risk. Do the math, and every trade is worth an average of +0.8 times your risk. Risking 1% per trade, that is around 80% growth over 100 trades.
That would put you ahead of almost every professional fund in the world. So the first test is free and takes a second: if a backtest says you are one of the best traders alive, the test is probably wrong.

Why Did It Fall Apart?
A backtest is not proof that a strategy works. It only proves that it would have worked on that one slice of past data. Here is where that gap usually comes from.
- Type of backtesting
- Manual backtesting (clicking through charts by hand) fails through human error. Even without meaning to, you already knew which years trended and which crashed, so your eye saw the price action to the right of the cursor before you made the decision. You took trades you would never have taken live and skipped ones that only “felt wrong” in hindsight.
- Automated backtesting (testing through code) fails in a different place: the data or the code. Bad historical data, such as gaps, wrong timestamps, or prices revised after the fact, can hand your strategy information it would never have had live. And a single bug, like an indicator reading today’s candle before it has closed, can quietly manufacture an edge that never existed.
- You tweaked it until the past looked perfect: you added a filter, then moved the stop loss from 40 to 43 pips because 43 tested better. Each change improved the historical result without improving the strategy itself. This is called curve fitting: describing the past instead of finding a real edge.
- The real costs were missing: a lot of traders backtest without adding the right commissions and spreads or forget them completely. The fill price can slip too. Your entry or stop does not always execute at the exact price you expected.
- Psychology gets in the way: the backtest assumed you would follow every rule exactly. In reality, fear makes you close winning trades early, and hope makes you move your stop loss further away when a trade turns against you. The strategy did not fail. You did not trade the plan you tested.
Five Tests That Catch It Early
None of the mistakes above are fatal, as long as you catch them before you start to execute. These five checks will show you the gap between the backtest and reality while it still costs you nothing. You do not need advanced software for any of these.
1. Hide Some of Your Data.
Develop the strategy on 70% of your history and never look at the other 30% until you are finished. Then run it once on the hidden part. If the results collapse, you curve fit. And if you go back and change the strategy afterwards, that data is no longer hidden, so you need a fresh piece.
2. Double Your Costs
Re-run the test with wider spreads, added slippage on every stop, plus commission and swap. A real edge survives costs worse than you expect to pay. A fake one only exists at perfect pricing.
3. Delete Your Best Trades
Remove the top 5% of your winners and check what is left. If deleting three trades turns the whole strategy flat, you did not find a system. You caught a few lucky moves.
4. Count Your Losing Streak
Work out the longest run of losses your win rate implies. At 72% wins, it is around 4 in a row across 200 trades. At a more realistic 45%, it is closer to 9. Knowing that number in advance is what stops you abandoning a working strategy during a completely normal bad patch.

5. Forward Test Before You Commit
Run the strategy on live prices in a demo or simulated account, in real time, for at least 100 trades. This is the only test where you cannot know the answer in advance, which is exactly what makes it worth doing. The FTMO Free Trial is a simple way to do this: 14 days in a simulated environment with the same rules as the FTMO Challenge, at no cost.
While you are there, check your worst days against the risk limits you trade under. In the FTMO Trading Objectives, that means the Maximum Daily Loss and Maximum Loss. A strategy can be profitable across a whole year and still break a daily limit in week two, and it is far better to discover that for free.
What You Actually Gain
Not certainty. Nothing gives you that.
What you get is your realistic expectancy, your normal drawdown, and your longest normal losing streak. Those three numbers are the difference between a trader who quits a good strategy during an ordinary rough patch and one who keeps going, for a reason, with evidence behind the decision.
Do not admire your equity curve. Attack it. If it still stands after your best attempt to break it, you may have something worth trading.

All information provided herein is intended solely for educational purposes related to trading on financial markets and does not constitute investment advice or serve in any way as a specific investment recommendation. Please read the full disclosure here.







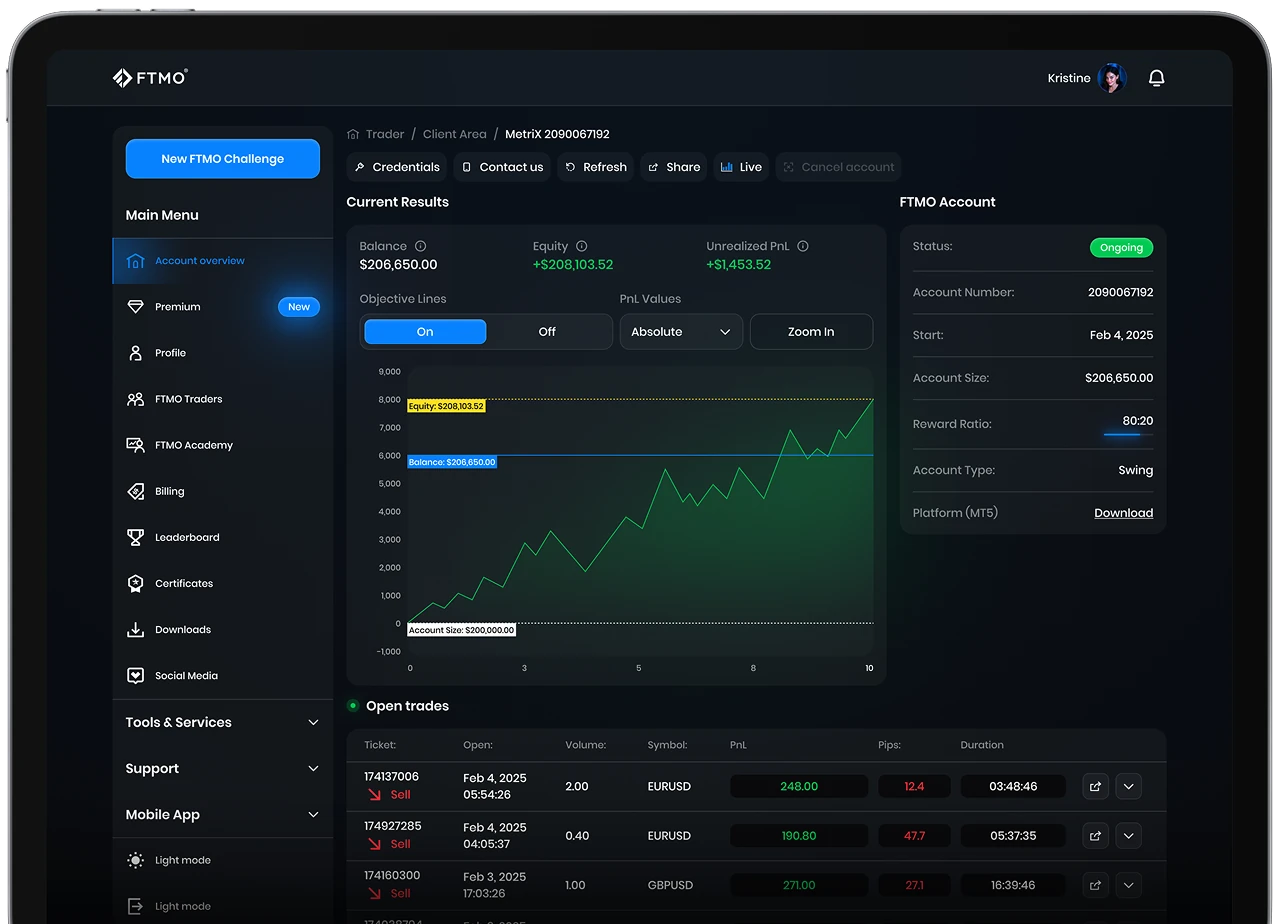
- As many Free Trials as you need
- Up to $200,000 account
- No time limit

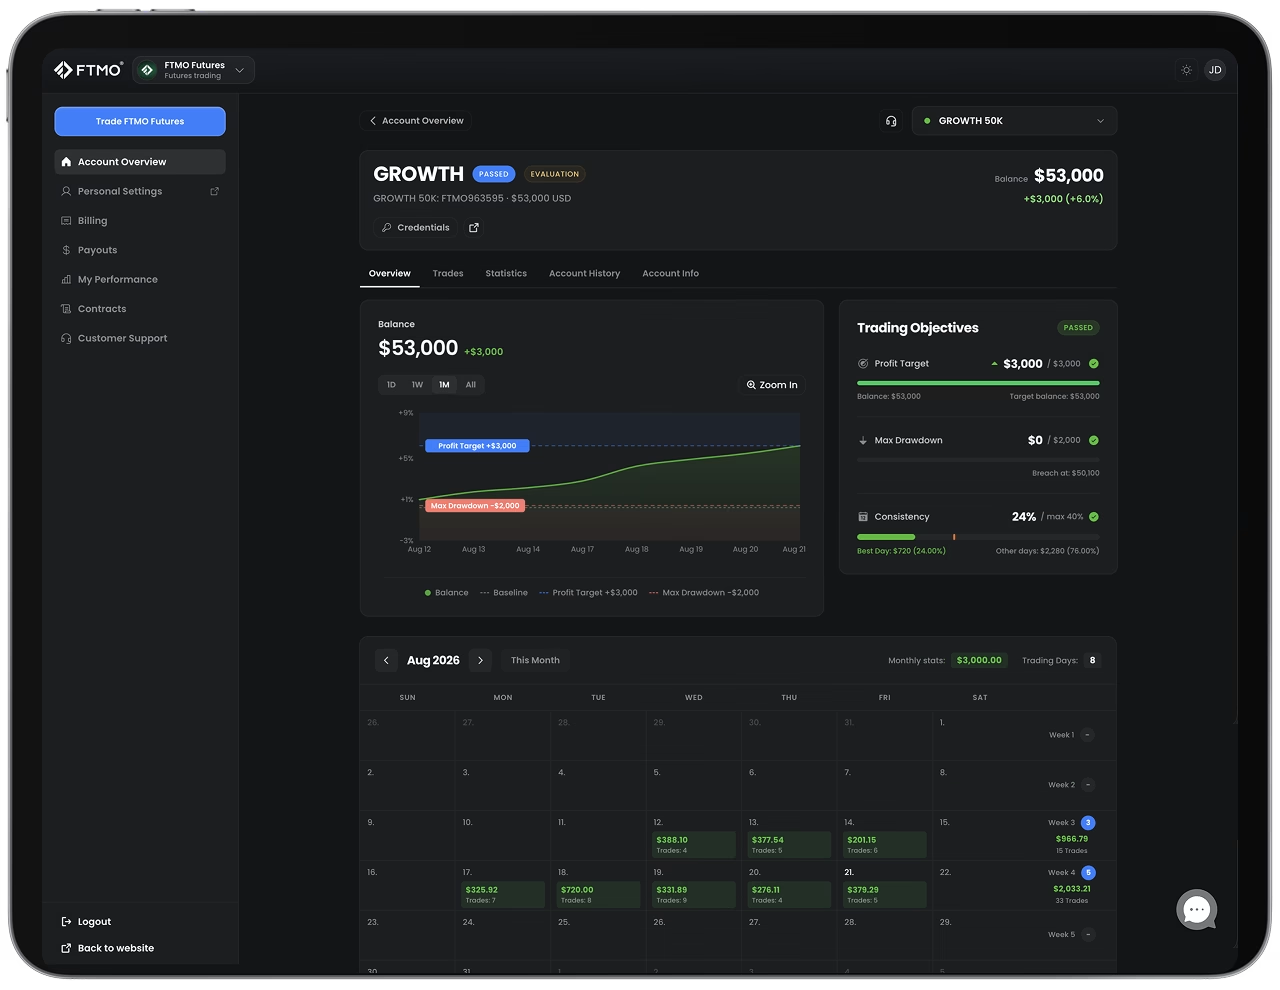
- Unlimited Evaluation Accounts
- Trade with up to 3 Sim-Funded accounts
- Up to $450,000 in simulated capital
- Keep up to 90% of your simulated profits


Worldwide Reviews