


Trading Under Pressure: Turning Early Losses Into a $37K Profit
This Successful Trader Story explores how a trader navigated early losses, survived a critical drawdown, and eventually produced $37,170.79 in profit on a $400,000 FTMO Account through disciplined risk management and consistent execution.
Scaling a $400,000 Account
The trader managed a combined FTMO Account worth $400,000, finishing the period with a balance of $437,170.79, representing $37,170.79 in profit and 9.2% growth. While this percentage might appear moderate at first glance, on a large account size it represents a significant absolute return and demonstrates how disciplined traders scale their performance.
The balance curve shows that the beginning of the period was far from smooth.
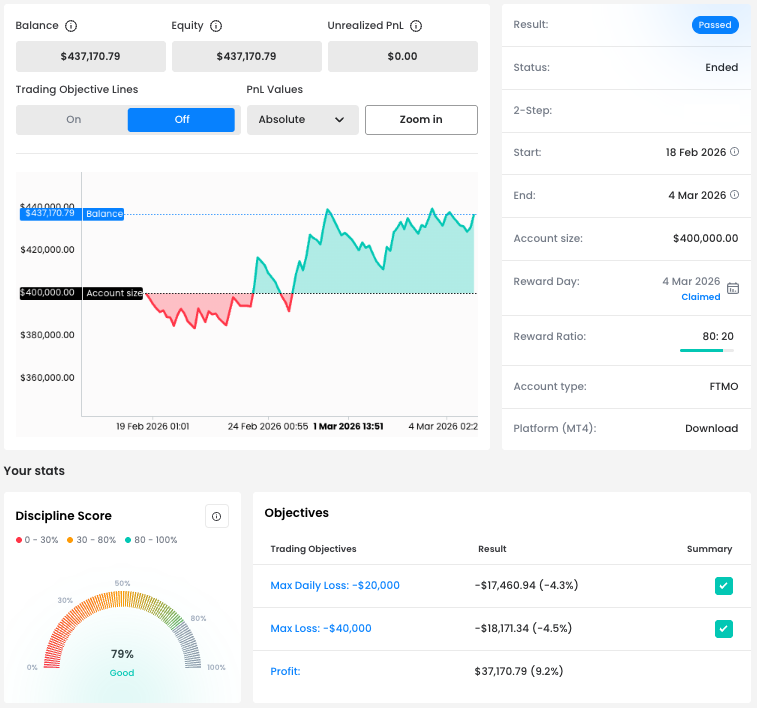
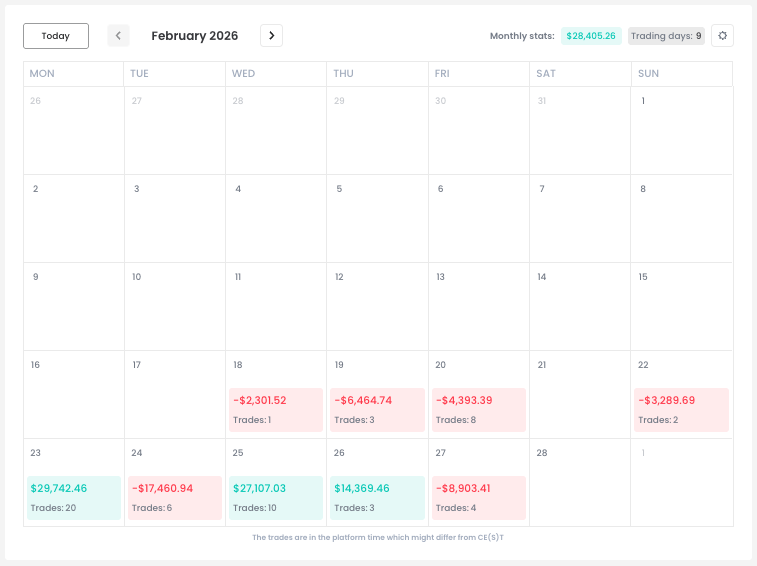
From February 18 to February 22, the trader remained consistently in negative territory. Rather than increasing risk to recover losses quickly, he maintained discipline and continued trading according to his plan.

When Discipline Matters Most
The most difficult moment occurred on February 24, when the trader recorded six consecutive losing trades and ended the day with a loss of -$17,460.94. This brought the account dangerously close to the $20,000 Max Daily Loss.
However, this moment also marked a turning point.
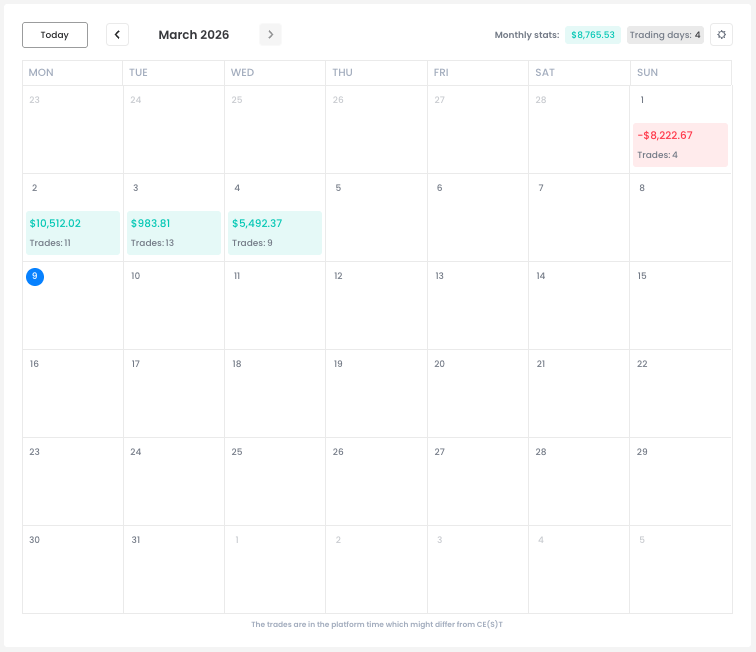
Instead of letting emotions dictate decisions, the trader maintained discipline and continued trading according to a predefined strategy. In the following days, the performance stabilised, and the account gradually moved into consistent profitability.
Such situations highlight an important reality of trading: temporary drawdowns are inevitable, but long-term results depend on how traders manage them.
Profitability Without Extreme Metrics
Looking at the statistics, the account does not rely on extraordinary metrics.
-
Win rate: 34.04%
-
Average RRR: 2.45
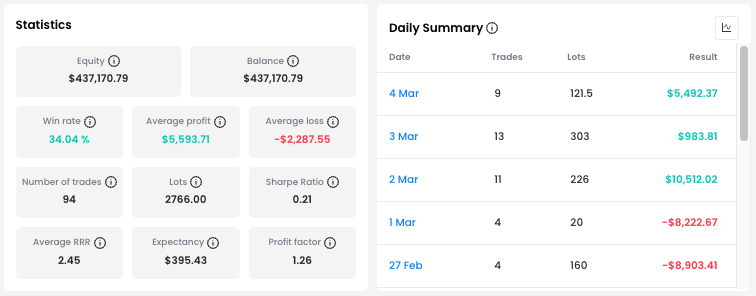
However, profitability in trading does not depend on a single metric, but rather on the relationship between them. As we can see, a strategy can remain profitable even with a relatively low Win rate if the Average profit is large enough compared to the Average loss.
No overhyped numbers, just a meaningful combination of Win rate and RRR that allowed the trader to maintain a positive expectancy over a larger sample of trades.

Trading Multiple High-Volatility Assets
The trader focused on three major instruments:
-
Gold (XAUUSD)
-
Bitcoin (BTCUSD)
-
US100.cash
Interestingly, the results differed significantly across these markets. While trades on US100.cash ended in overall loss, both gold and Bitcoin generated the majority of the profits.
Long and short positions were almost evenly balanced, suggesting that the trader primarily reacted to short-term price action and market momentum rather than long-term directional views.
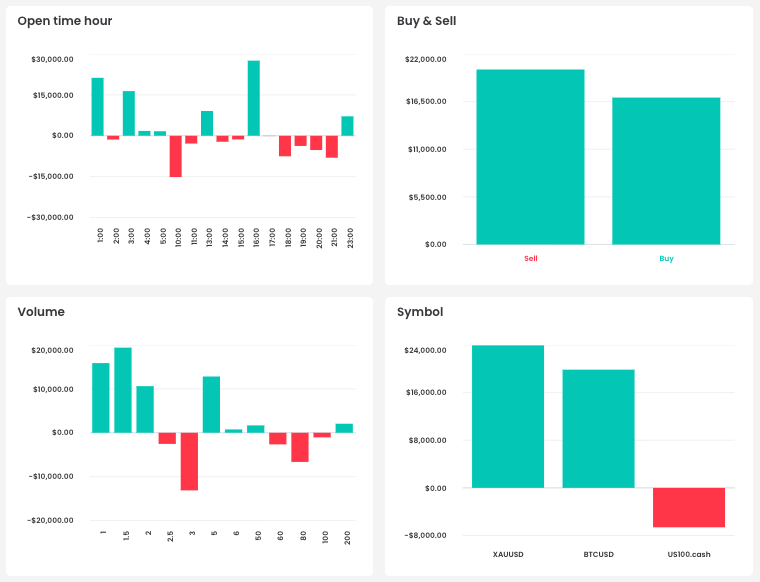
The Open Time Hour chart reveals another interesting pattern. The trader achieved the strongest results during three periods:
-
01:00 platform time
-
03:00 platform time
-
around 16:00 platform time
The early hours likely correspond to higher activity in cryptocurrency markets, while the afternoon performance aligns with the London–New York session overlap, a period known for high liquidity and volatility in assets like gold. Higher volatility during these periods often creates more opportunities for short-term strategies such as scalping.
Case Study: Long on XAUUSD
The duration of individual trades suggests that the trader was primarily a scalper. However, when a trade developed strongly in the intended direction, as we can see in this example, the trader had no problem keeping the position open for several hours.
One of the most interesting trades during this period was a long position on gold (XAUUSD) that remained open for more than five hours and produced a profit of $9,019.59.
The entry came after the market formed two higher lows, suggesting that buyers were gradually gaining control. This structure often indicates strengthening support and increasing bullish momentum.

The trader opened the position at 5,147.60, placing a Stop Loss at 5,135.00 near the support area. Shortly after entry, price briefly moved against the position, reaching a Maximum Adverse Excursion (MAE) of 5,141.36, but the support held.
Once buyers stepped back in, gold began a strong intraday rally. The position eventually reached a Maximum Favourable Excursion (MFE) of 5,199.03 before the trader exited the trade at 5,192.77, capturing approximately 45 pips.
Key Takeaways
This trading period demonstrates that success in the markets rarely comes from perfect statistics. Instead, it is usually the result of disciplined execution, consistent risk management, the ability to recover from drawdowns, and sticking to a structured process. Even with moderate metrics, a trader can achieve strong results if the strategy maintains positive expectancy and controlled risk exposure.
Note: Since we cannot clearly define the exact trader's strategy from the chart, this is only the private opinion of the author of this article. FTMO Traders are free to choose their strategy, and as long as they do not explicitly violate our Terms and Conditions and follow our risk management rules, the choice of strategy and execution of individual trades is up to them.

This article is for informational purposes only, and some information may not reflect the current service offering or product features. Please always verify the latest terms on the official product pages.
About FTMO
FTMO has developed a two-step evaluation process to find trading talents. Upon successful completion, you may be eligible for an FTMO Rewards Account with a balance of up to $200,000 in simulated funds. How does it work?