


How to use accumulation, manipulation and distribution in trading
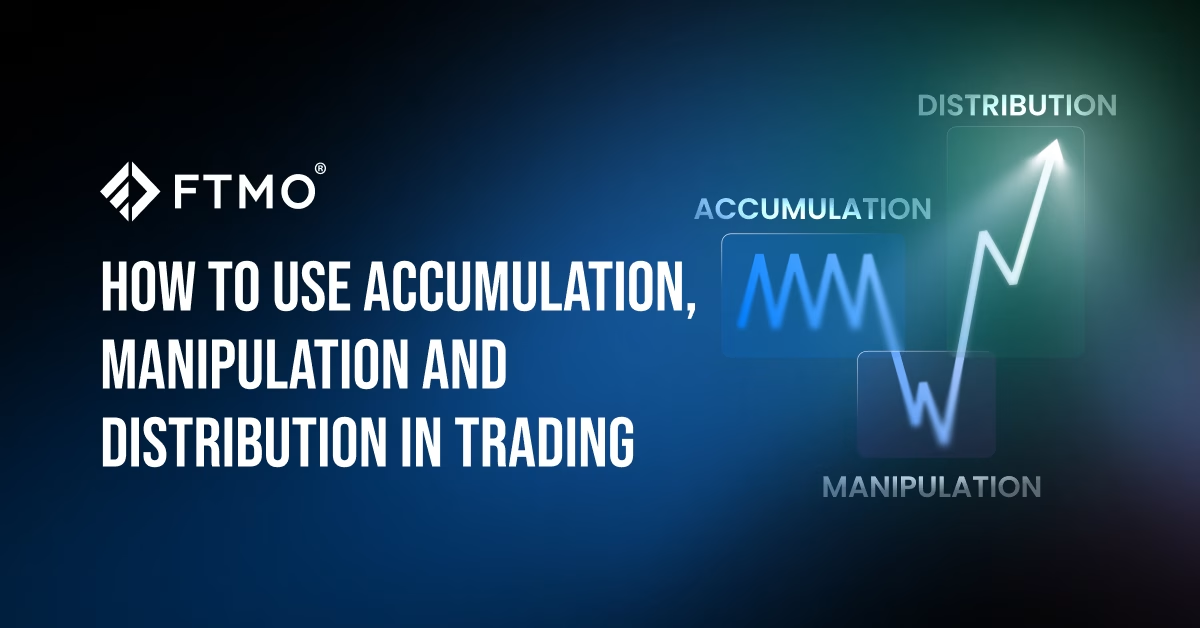
If you want to understand what is happening in the markets at any given time, you need to grasp the actions and motivations of the major players. One approach that aims to reflect this “smart money” behavior is to track the three phases of the market: accumulation, manipulation, and distribution.
This approach is a simplified version of the methodology defined by Richard Wyckoff, which we wrote about on our blog some time ago. Both approaches assume that markets move in cycles influenced by the supply and demand dynamics of large institutional players. However, Wyckoff’s theory describes accumulation and distribution somewhat differently, and for some traders and investors, understanding and identifying market structure can be challenging.

Get to Know the Smart Money Approach
The AMD approach, also known as the “Power of 3” from ICT (Inner Circle Trading, a concept popularized by trader Michael J. Huddleston), is designed to help traders better understand market movements, avoid false signals, and achieve improved results. While this is the goal of any strategy, AMD has recently attracted considerable interest—so let’s take a closer look.
The principle is simple at first glance. Unlike the Wyckoff method—which originated some time ago and is more suited to investing in stock markets—AMD can also be applied to trading markets such as forex. The core of the method is identifying the three key phases in which large investors manage their positions: accumulation at a specific price level, manipulation aimed at shifting retail sentiment, and distribution of liquidity to maximize profits.
This often results in losses for retail traders, which is why identifying these smart money patterns as early as possible is crucial. In essence, it’s a psychological game, where smart money creates specific market conditions—manipulating not only prices but also the emotions of retail traders—in order to shift liquidity from retail participants into their own hands.

Accumulation
The first phase is accumulation, which often appears as short-term consolidation, where the price seems to lack clear direction at first glance. Retail traders typically open long positions near the top (resistance) and short positions near the bottom (support) of this range, anticipating a breakout. They then place their stop-loss orders on the opposite sides of the range—above resistance and below support.
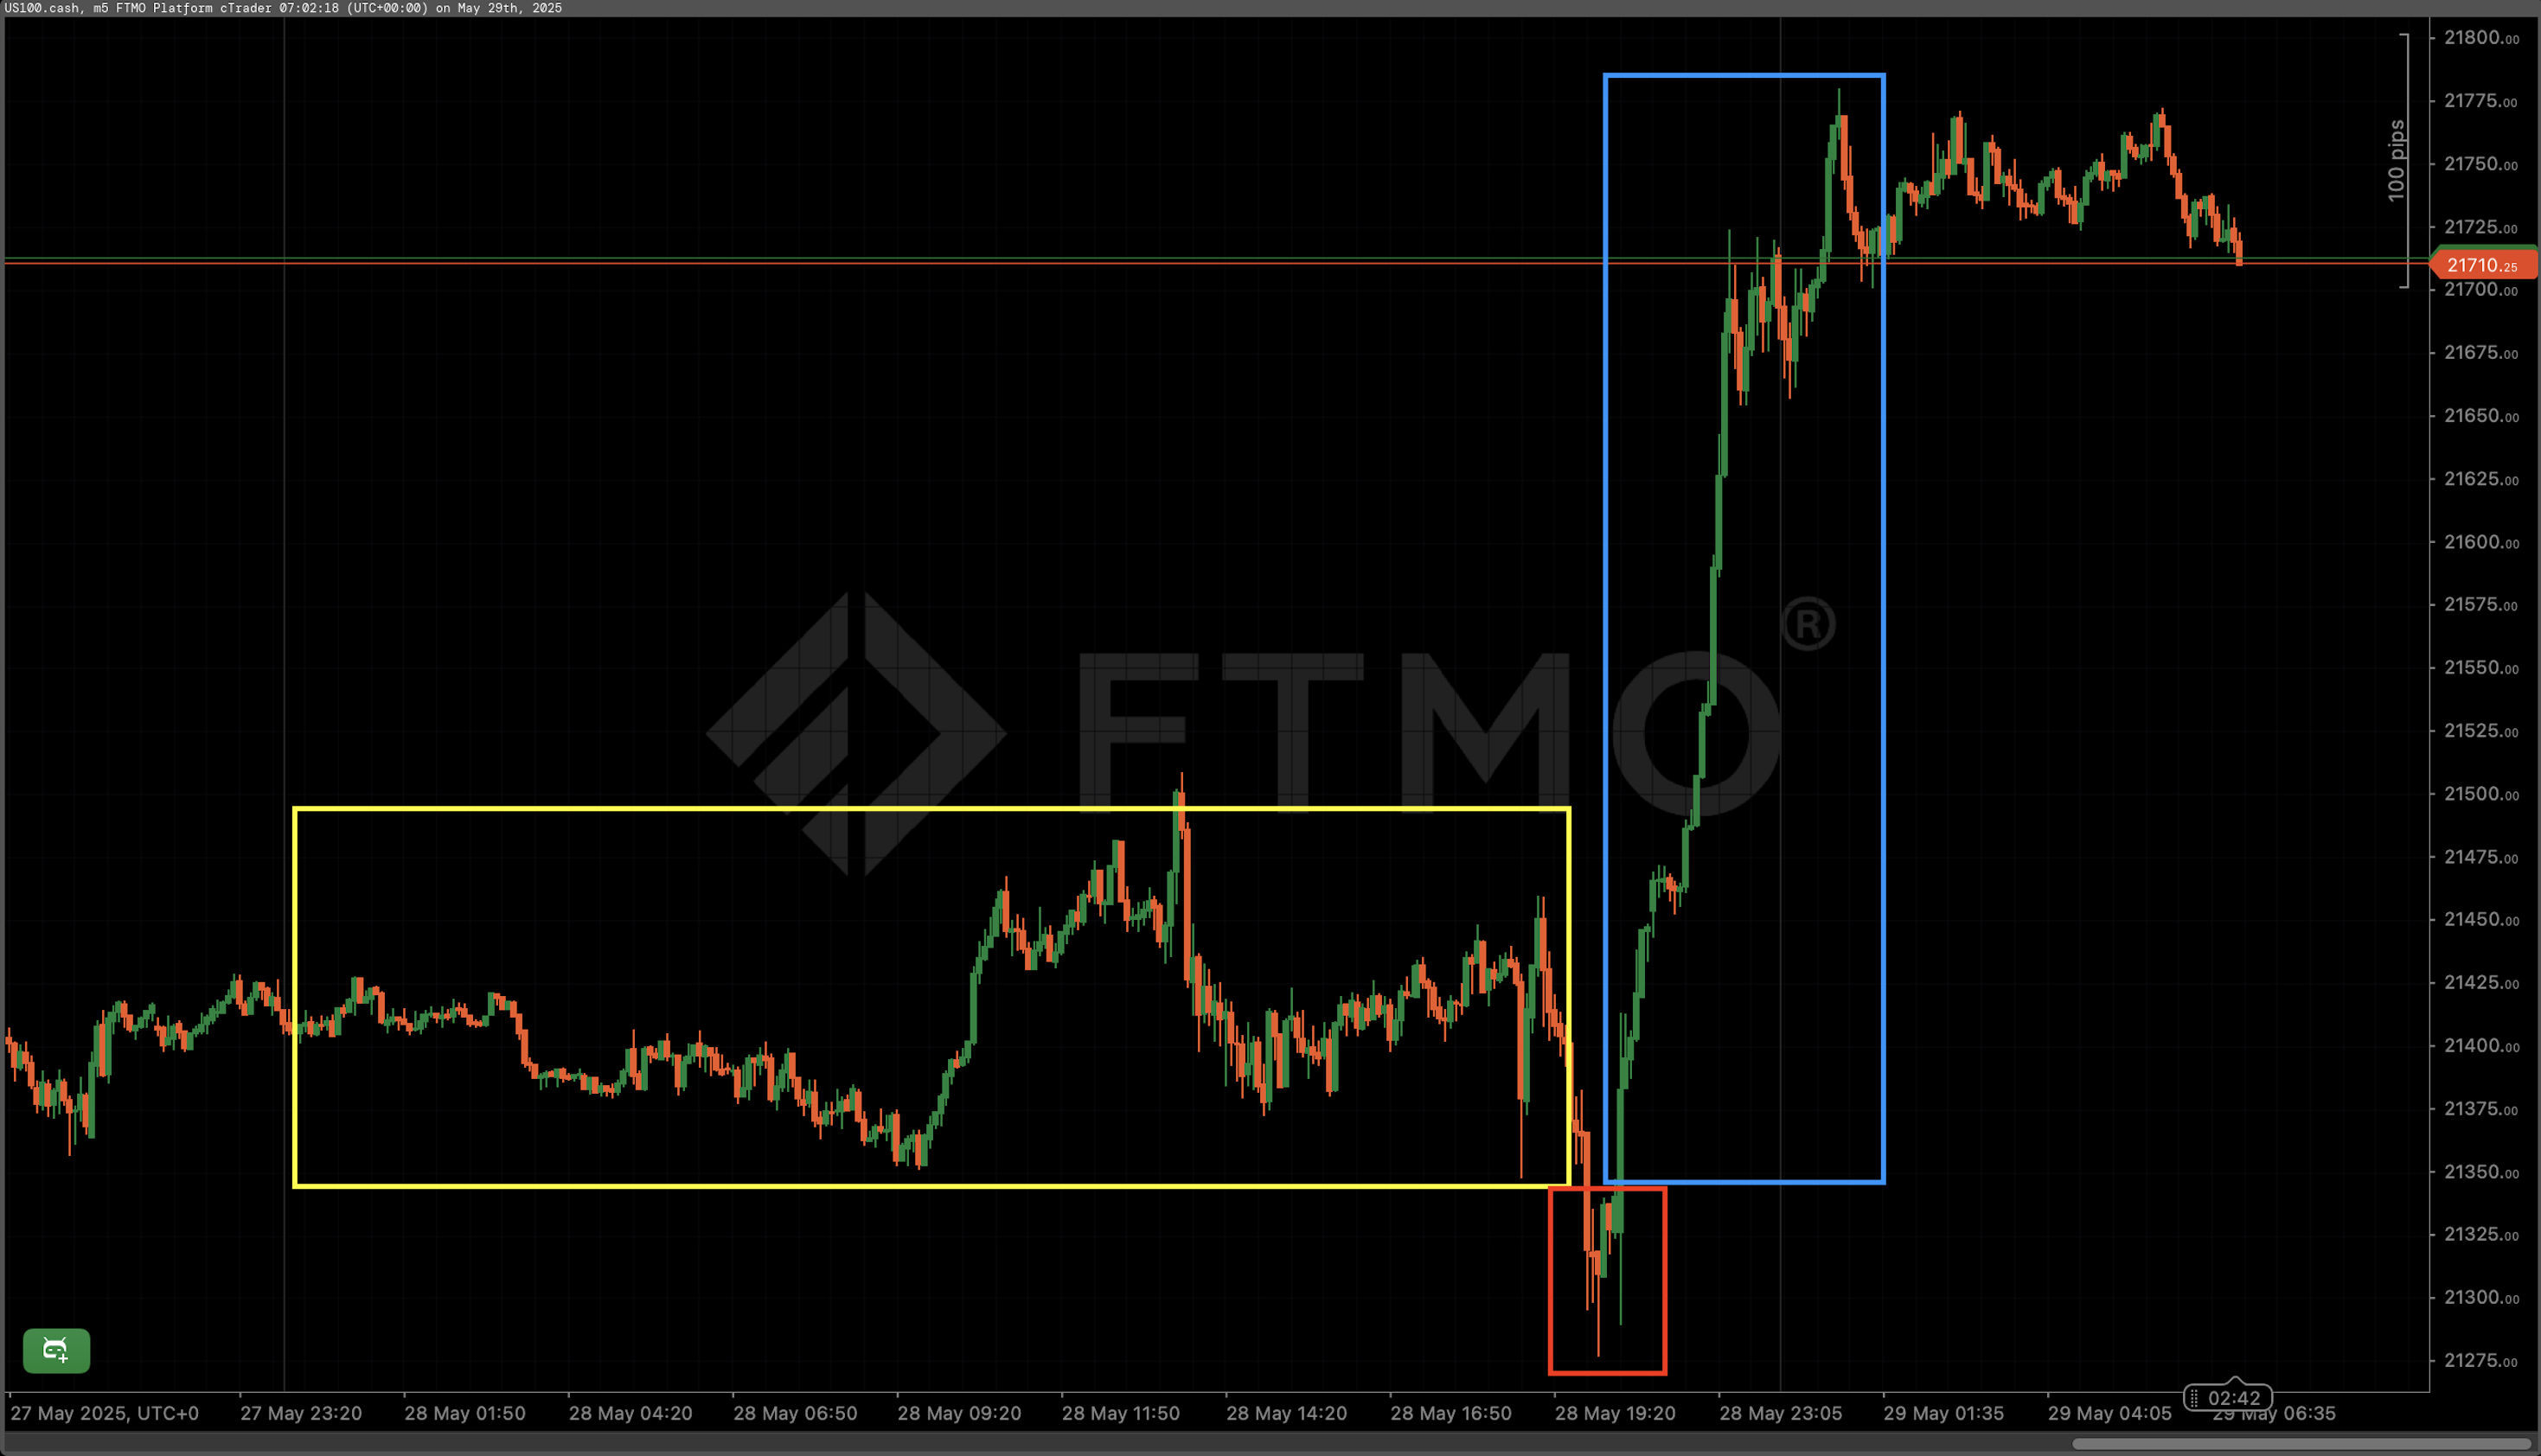
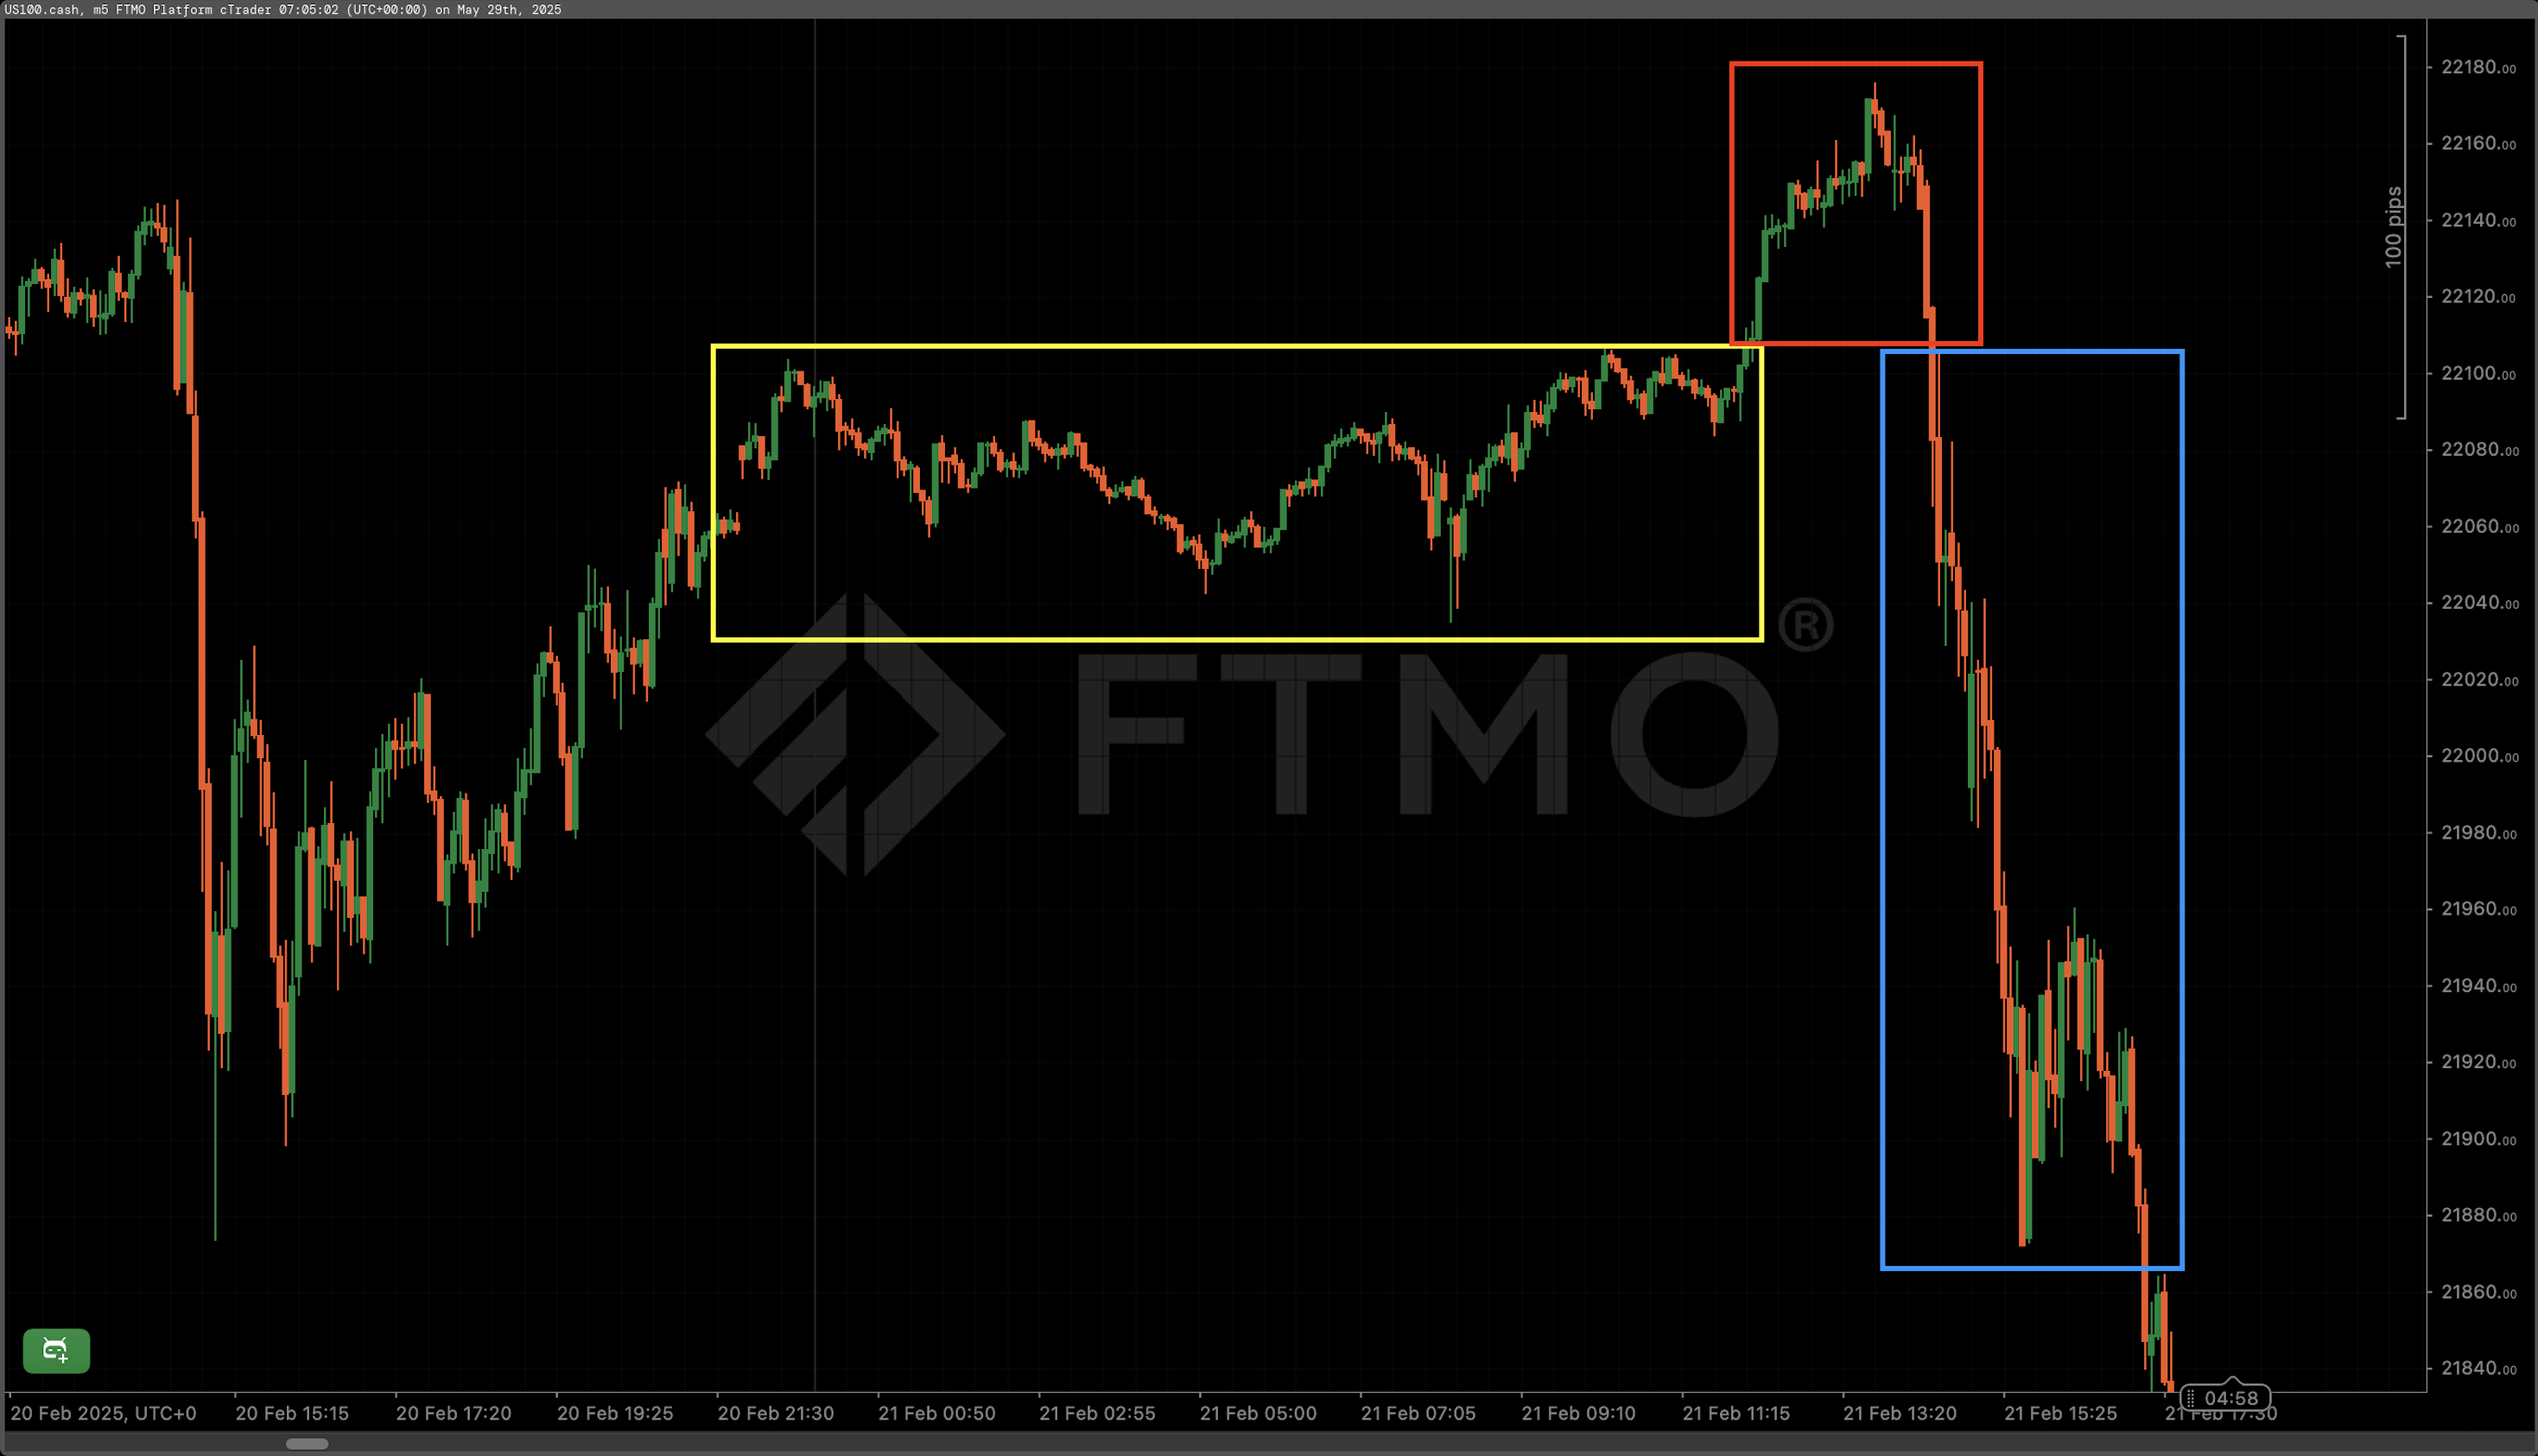
During this phase, market volumes are relatively low, making it difficult for retail traders to predict the next possible movement. Psychologically, this tests their patience while smart money quietly accumulates positions and waits for the right moment to act. In both the first and second diagrams, this phase is marked with a yellow rectangle.
Manipulation
In the second phase, large institutional players enter the market in significant volume, pushing the price sharply in one direction. This triggers the stop-losses of one group of retail traders—providing liquidity to smart money—or leads another group to open new positions, unaware that they are falling into a trap created by false signals.
Retail traders often react emotionally during this phase, resulting in excessive losses or overly aggressive position sizing, chasing what they believe will be larger profits. In the diagrams, the manipulation phase is marked with a red rectangle.
Distribution
In the final phase, distribution, smart money once again takes control—entering positions at optimal prices and driving the price in the opposite direction of the earlier manipulation phase, now on increasing volume. The goal is to extract liquidity from the retail sector, which entered trades during the manipulation phase expecting profit, only to have their stop-losses triggered during distribution.
This phase is marked by higher trading volumes and a more decisive move in the direction that benefits large institutional players. In the diagrams, it is represented by the blue rectangle, typically the longest of all three phases. By the end of this phase, when the institutional players have already secured their profits, they offload their positions to retail traders—those who enter too late.
How to trade AMD?
One of the key principles in identifying AMD phases is to view them in the context of the broader market—to create a bigger picture. According to ICT, being able to recognize the daily trend is essential. For example, the fact that smart money often initiates accumulation and subsequent manipulation near the market open can help traders anticipate the setup.
Large investors may either accumulate buy orders and then push the price downward, leading retail traders to mistakenly interpret it as a downside breakout. Alternatively, they might accumulate sell orders and then drive the price upward, prompting retail traders to enter long positions under the false impression of a bullish breakout.
In both cases, the objective of smart money is to extract liquidity from retail traders who get caught either in the accumulation or manipulation phase. Our goal is to avoid these traps by recognizing them early.
Practice makes perfect
As with any other strategy, AMD requires traders to develop a solid “feel” for market behavior. This comes from testing and practicing the strategy over a sufficiently long period of time. It’s generally advisable to identify the daily trend on a higher timeframe, such as H1 or H4, while entries and identification of individual market phases are better executed on a lower timeframe, such as M15.
When identifying the accumulation phase, it’s important to recognize consolidations where the price moves within a defined range and both volume and volatility are below average. This often occurs near key support or resistance levels.
Next, the manipulative move must be identified—particularly its length. Then, using changes in market structure or identifying so-called order blocks, the trader can detect the transition from the manipulation phase to the distribution phase.
Retail traders should avoid trying to trade all three phases. There’s little benefit in doing so, as the final phase typically presents the largest and most favorable move, offering the best return with the most attractive risk-to-reward ratio (RRR). Trade safely!

All information provided herein is intended solely for educational purposes related to trading on financial markets and does not constitute investment advice or serve in any way as a specific investment recommendation. Please read the full disclosure here.





- As many Free Trials as you need
- Up to $200,000 account
- No time limit

- Unlimited Evaluation Accounts
- Trade with up to 3 Sim-Funded accounts
- Up to $450,000 in simulated capital
- Keep up to 90% of your simulated profits


Worldwide Reviews