


How to Prepare for 2026 as a Trader
A new year in the markets is not about predicting direction. It is about preparation. Traders entering 2026 without a clear macroeconomic and fundamental framework expose themselves to unnecessary risk. These factors define the environment in which markets operate and determine which scenarios carry the highest probability.
In this article, we outline the key macro themes shaping 2026 and examine their impact across major asset classes. We then connect this broader context with a technical outlook on selected instruments.
What to Expect from the Macro Environment in 2026
The year 2026 enters the markets as a transitional period. While the global economy remains relatively resilient, growth is fragile and increasingly sensitive to new impulses. For traders, this means markets are likely to react more to shifts in expectations than to headline data itself.
Monetary policy will remain a key driver, particularly actions and communication from the Federal Reserve. Even if interest rates remain largely unchanged, markets will closely monitor inflation data, labour market conditions, and guidance from Fed officials. These factors will shape expectations and ultimately market direction.
Ahead of the upcoming Federal Reserve meeting on 28 January, no further rate cut is currently expected. According to the CME FedWatch Tool, approximately 73.4% of market participants are pricing in no change to interest rates.

Indices
Equity indices reached record highs in 2025, supported by monetary easing and strong performance in the technology sector. Optimism surrounding artificial intelligence, alongside strong earnings from major technology companies such as Nvidia and Palantir, played a significant role in driving market sentiment.
The key question for 2026 is whether this momentum can be sustained. While growth expectations remain intact, markets are becoming increasingly sensitive to valuations and to whether optimism, particularly in the technology sector, can translate into durable earnings growth.
For traders, this implies that equity indices may no longer rise automatically. Price action is likely to be driven more frequently by macroeconomic surprises, changes in interest rate expectations, and reactions to earnings results.
Commodities
Commodity markets in 2026 are expected to be heavily influenced by supply-demand imbalances, geopolitics, and trade policies. These factors create conditions where prices can quickly detach from short-term expectations and transition into impulsive moves, as seen in gold and silver during 2025.
From a trading perspective, key factors to monitor include:
- Developments related to tariffs and trade restrictions that may disrupt supply chains
- Industrial metals, particularly copper and aluminium, where supply remains tight
- Oil’s reaction to geopolitical events and changes in production levels
- Gold’s behaviour during periods of rising uncertainty and declining real yields

Crypto
Cryptocurrencies enter 2026 as a more mature and widely monitored market compared to previous cycles. In 2025, the approval of multiple crypto ETFs, including products linked to Bitcoin and selected altcoins such as Solana and Litecoin, increased institutional participation and moved crypto closer to traditional financial markets.
Despite this evolution, the core market dynamics remain unchanged. Prices are still highly dependent on liquidity conditions and overall risk sentiment.
In 2026, traders should focus on:
- The Fear and Greed Index as a real-time gauge of market sentiment
- Interest rates and monetary policy expectations, which directly influence liquidity and risk appetite
- Activity from large players and institutional investors, which may signal regime shifts
- Crypto’s reaction to equity market movements, particularly during periods of elevated volatility
Technical Outlook for 2026
To assess the prevailing trend, we applied a combination of Fair Value Gaps, Exponential Moving Averages (EMA 20 and EMA 50), and the Ranged Volume Profile. Together, these tools highlight momentum, structural levels, and the balance between price and volume.
US100
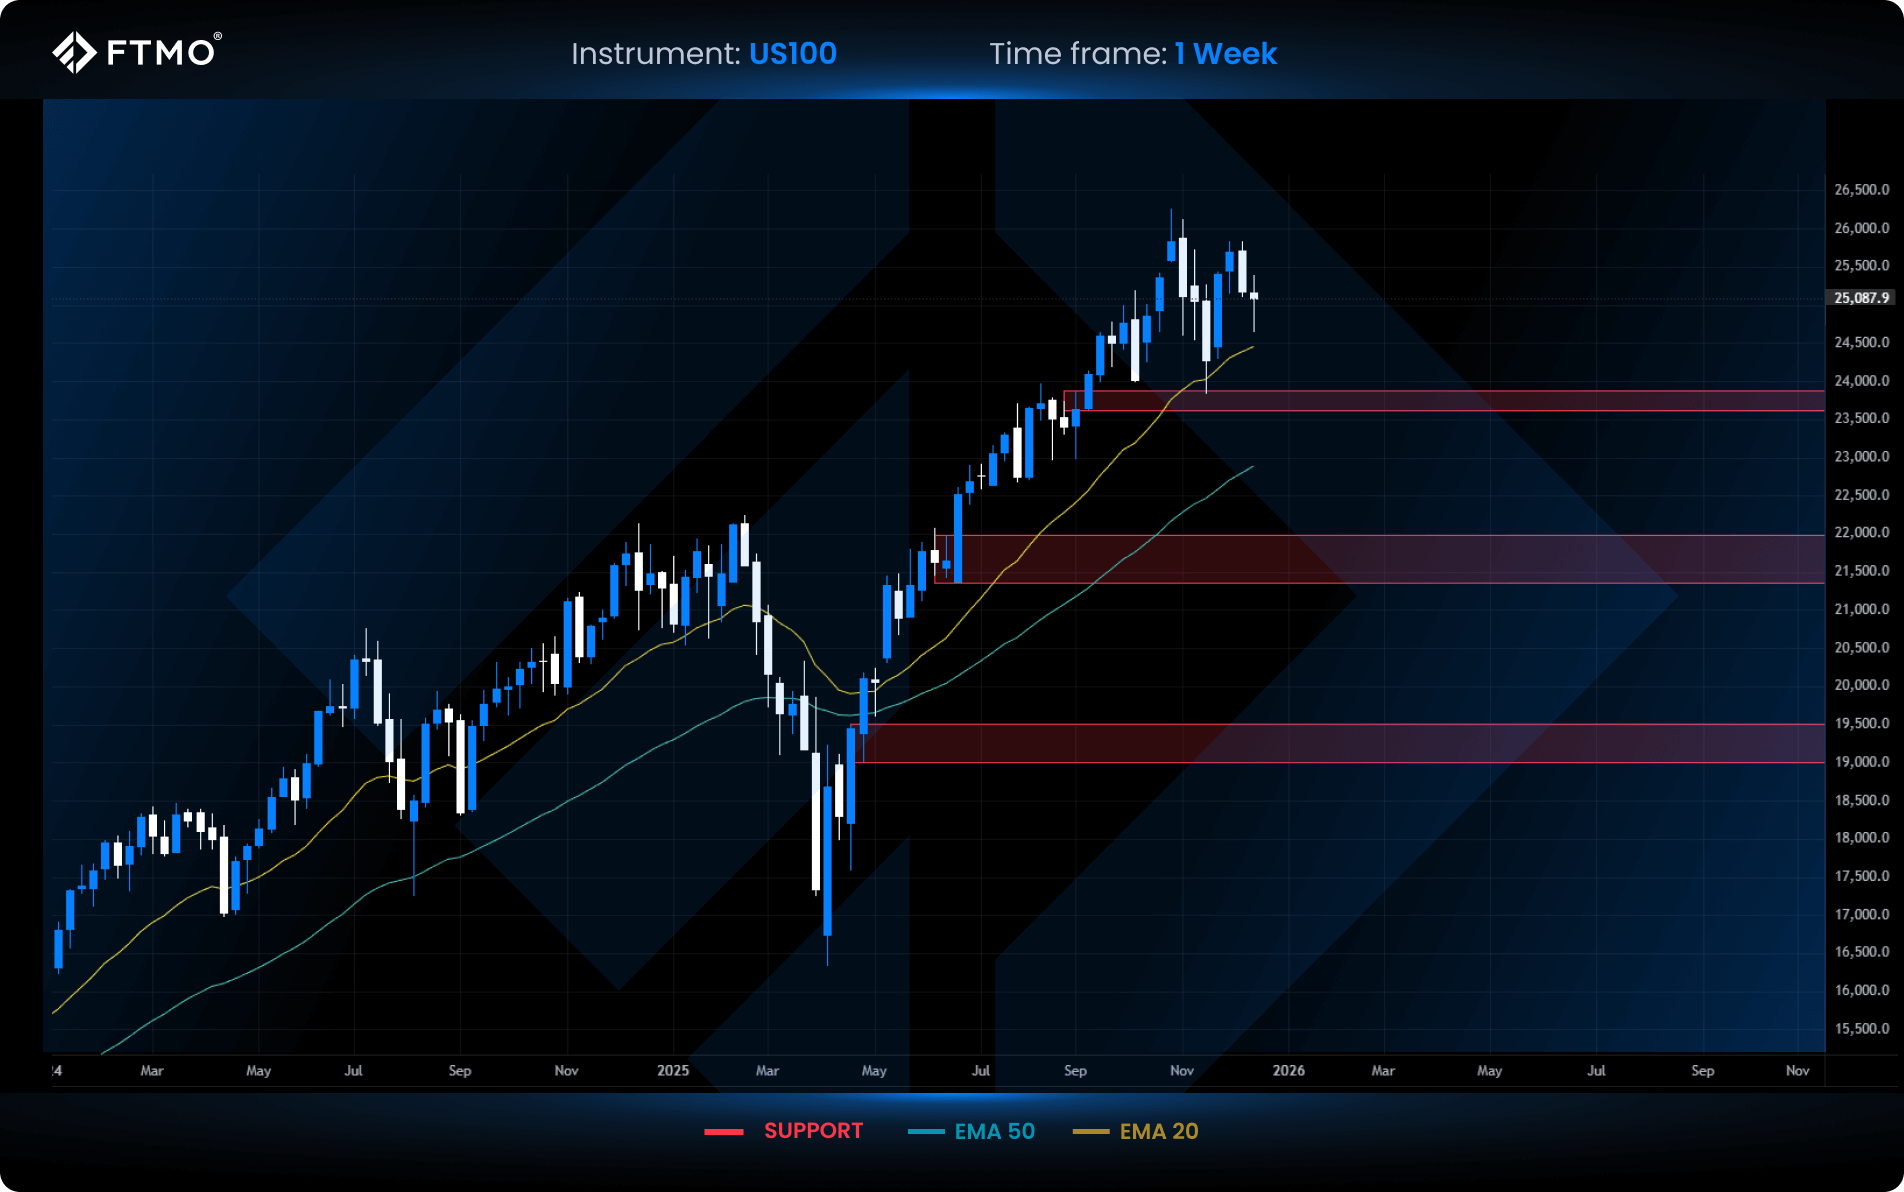
Support Zones
-
$23,876 to $23,609
This support zone is formed by a Fair Value Gap and a prior swing low, adding validity as the level has already been defended in the past. -
$21,970 to $21,350
A support zone derived from a Fair Value Gap, representing an area where buyers previously stepped in. - $19,500 to $19,000
This zone marks the origin of a strong bullish impulse and aligns with the lower boundary of a Fair Value Gap, making it a key structural support.
XAUUSD
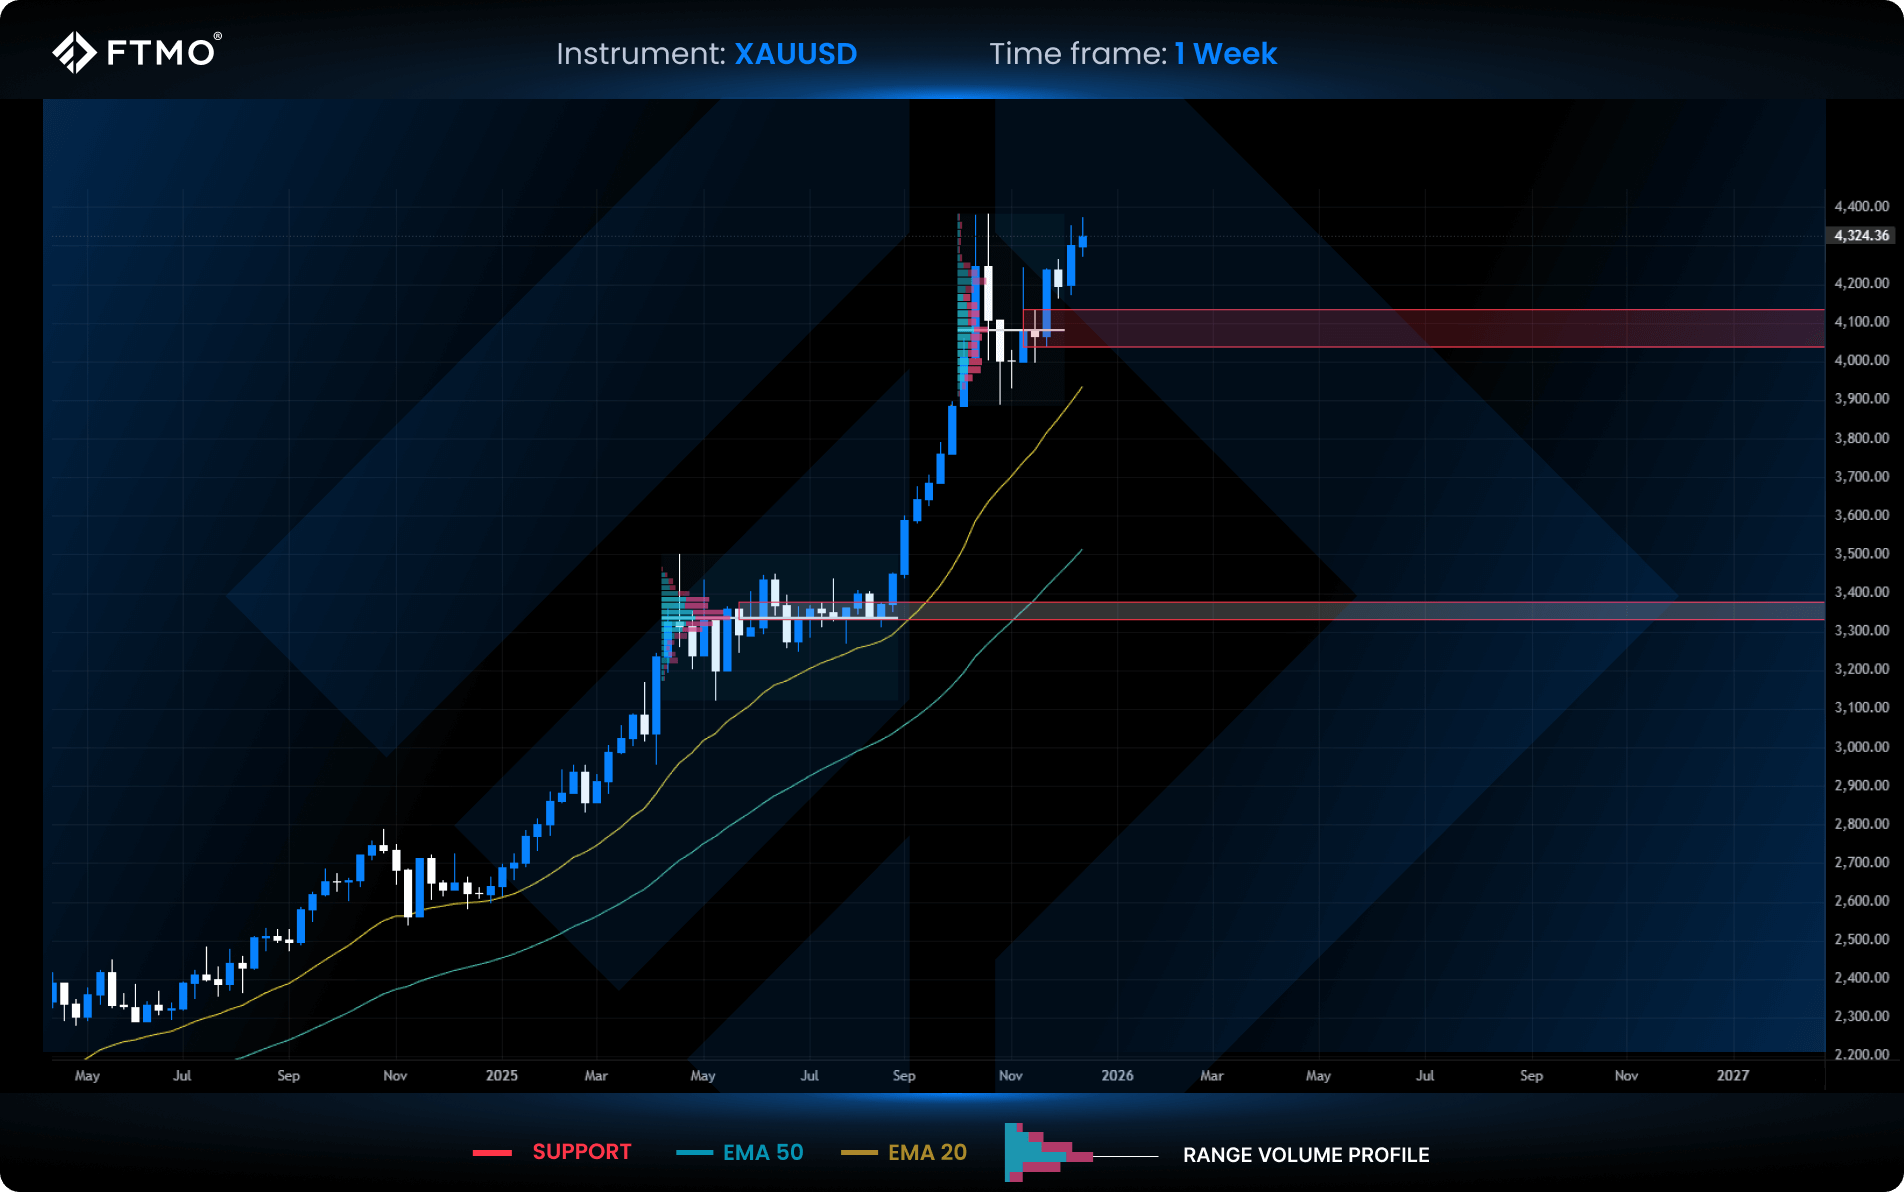
Support Zones
-
$4,135 to $4,039
Support formed by current volume concentration within the range, combined with the edge of a Fair Value Gap. -
$3,380 to $3,330
A strong long-term support zone supported by several months of volume accumulation and the boundary of a Fair Value Gap prior to a strong bullish trend.
BTCUSD
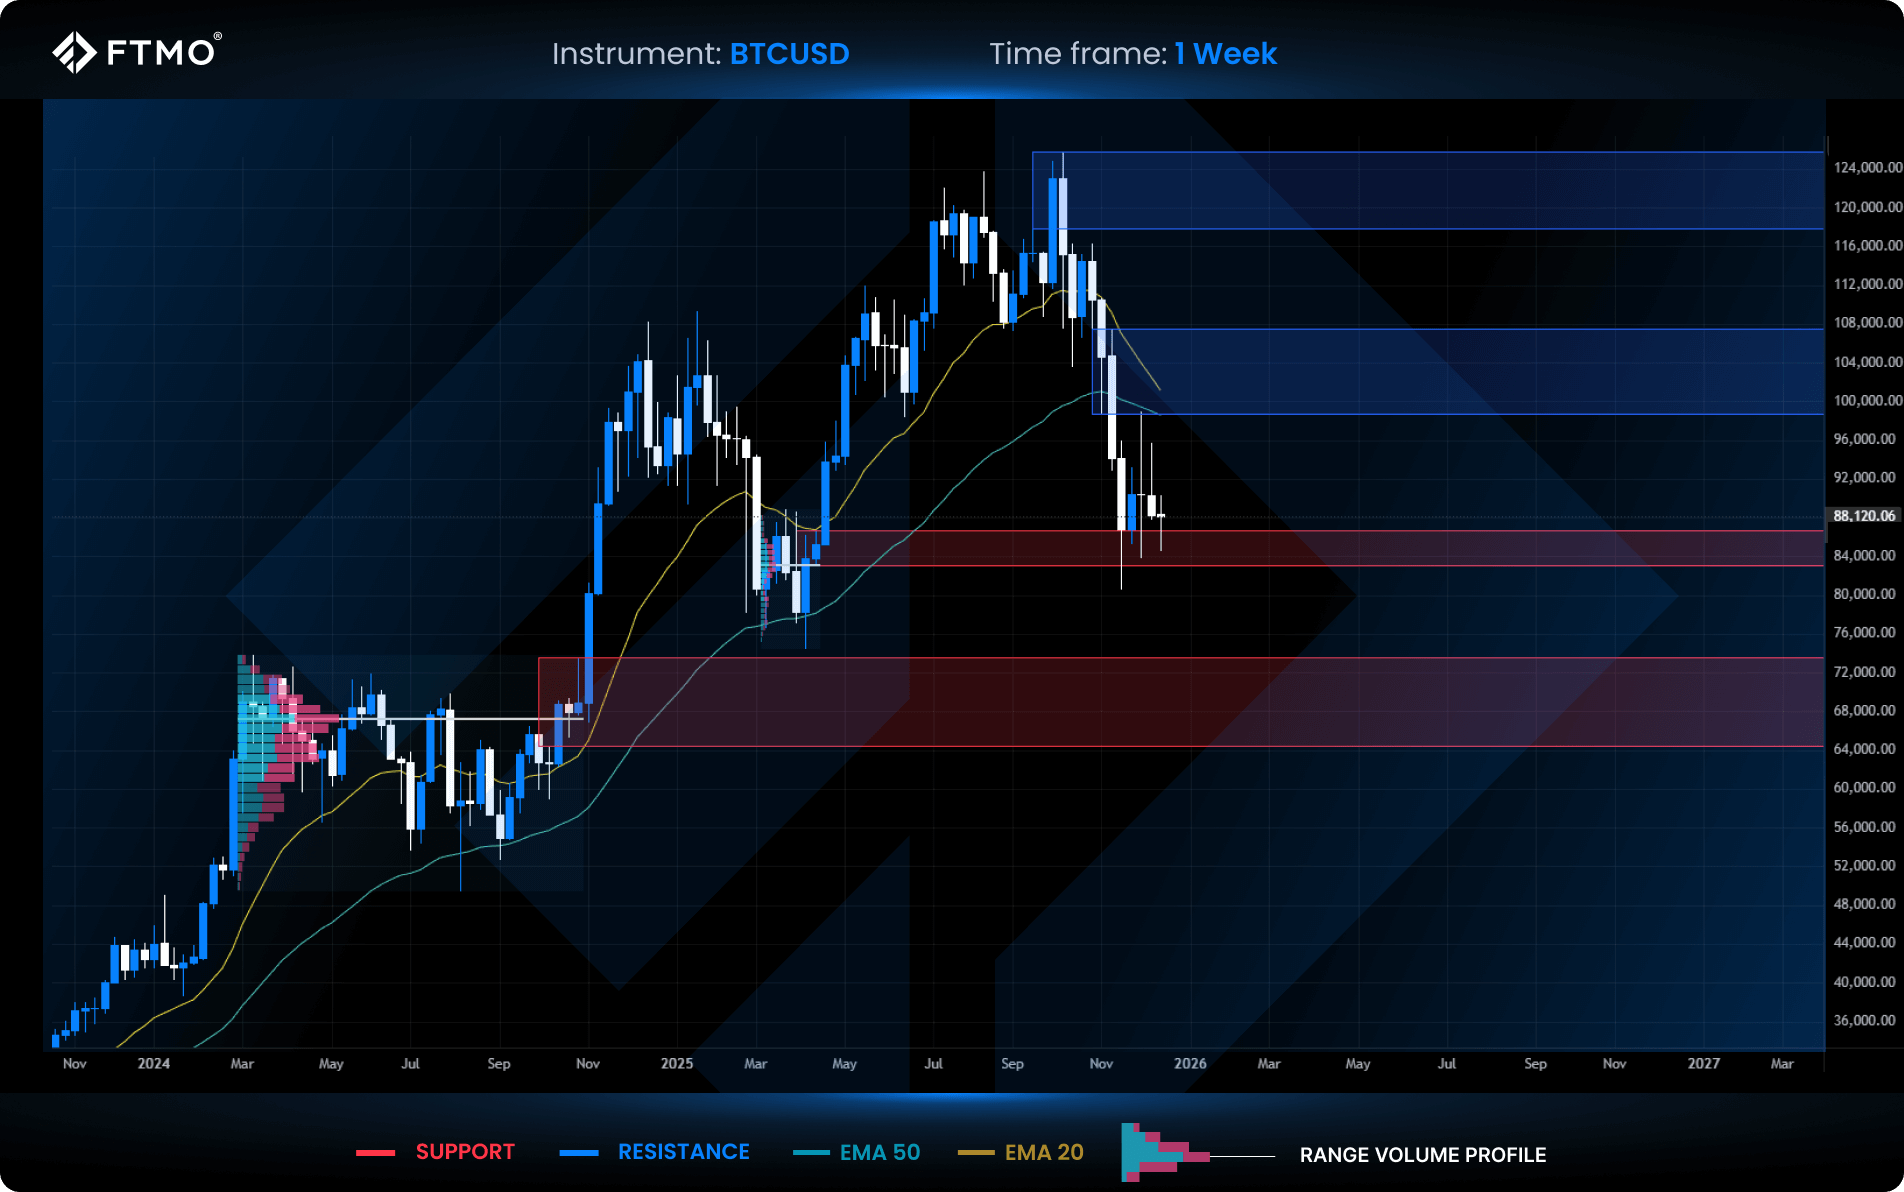
Resistance Zones
-
$98,720 to $107,620
This resistance zone is formed by a Fair Value Gap and is currently reinforced by the 20 and 50 EMA, increasing its technical significance. -
$118,000 All-Time High
A major resistance area defined by high-volume trading activity around the all-time high. This zone represents a highly liquid level where a large number of orders are expected.
Support Zones
-
$86,600 to $83,000
Support formed by volume concentration within the range and the boundary of a Fair Value Gap. This area currently acts as a strong base for potential upside continuation. -
$73,640 to $64,500
The strongest support zone on the chart, defined by several months of volume accumulation and the edge of a Fair Value Gap.
Entering 2026 with Confidence and Control
Preparing for 2026 is not about predicting the next move. It is about trusting your process, staying disciplined under pressure, and making decisions with clarity rather than emotion.
At FTMO, we wish you a year marked by focus, consistency, and respect for risk. Trade with confidence, protect your capital, and stay committed to long-term performance.

All information provided on this site is intended solely for educational purposes related to trading on financial markets and does not serve in any way as a specific investment recommendation, business recommendation, investment opportunity analysis or similar general recommendation regarding the trading of investment instruments. FTMO only provides services of simulated trading and educational tools for traders. The information on this site is not directed at residents in any country or jurisdiction where such distribution or use would be contrary to local laws or regulations. FTMO companies do not act as a broker and do not accept any deposits. The offered technical solution for the FTMO platforms and data feed is powered by liquidity providers.
This article is for informational purposes only, and some information may not reflect the current service offering or product features. Please always verify the latest terms on the official product pages.
About FTMO
FTMO has developed a two-step evaluation process to find trading talents. Upon successful completion, you may be eligible for an FTMO Rewards Account with a balance of up to $200,000 in simulated funds. How does it work?