


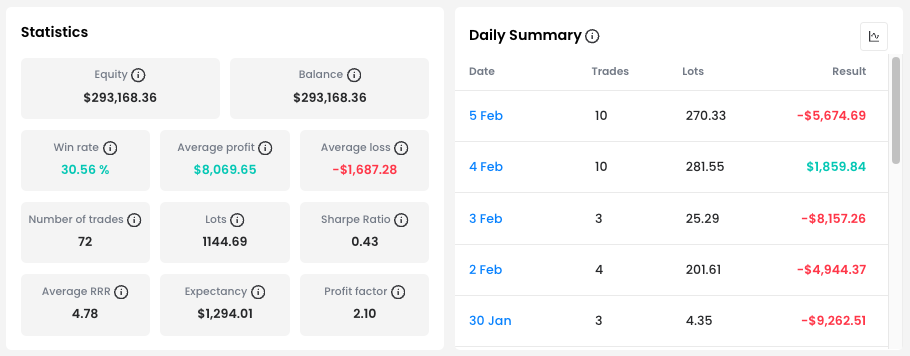
Additional key figures further reinforce this profile. Over the period, the trader executed 72 trades, with an Average profit of $8,069.65 and an Average loss of –$1,687.28, resulting in a solid Profit factor of 2.10. This combination clearly shows that the trader did not need to be right often. He needed to be right big.

Successful Traders Stories
High RRR in Action: How Patience Delivered a $93,168 Profit
In this part of the Successful Trader Story, we focus on a trader who delivered an exceptional $93,168.36 profit in less than three weeks on a $200,000 FTMO Account. His edge did not come from high trade frequency or consistency early on, but from one defining factor: exceptional reward-to-risk efficiency.
A Rough Start Followed by a Structural Shift
The Balance Curve shows that the trading period did not begin smoothly. On the very first day, the trader came dangerously close to breaching the Max Daily Loss, with the first five trades resulting in a combined daily drawdown of –$9,028.14.
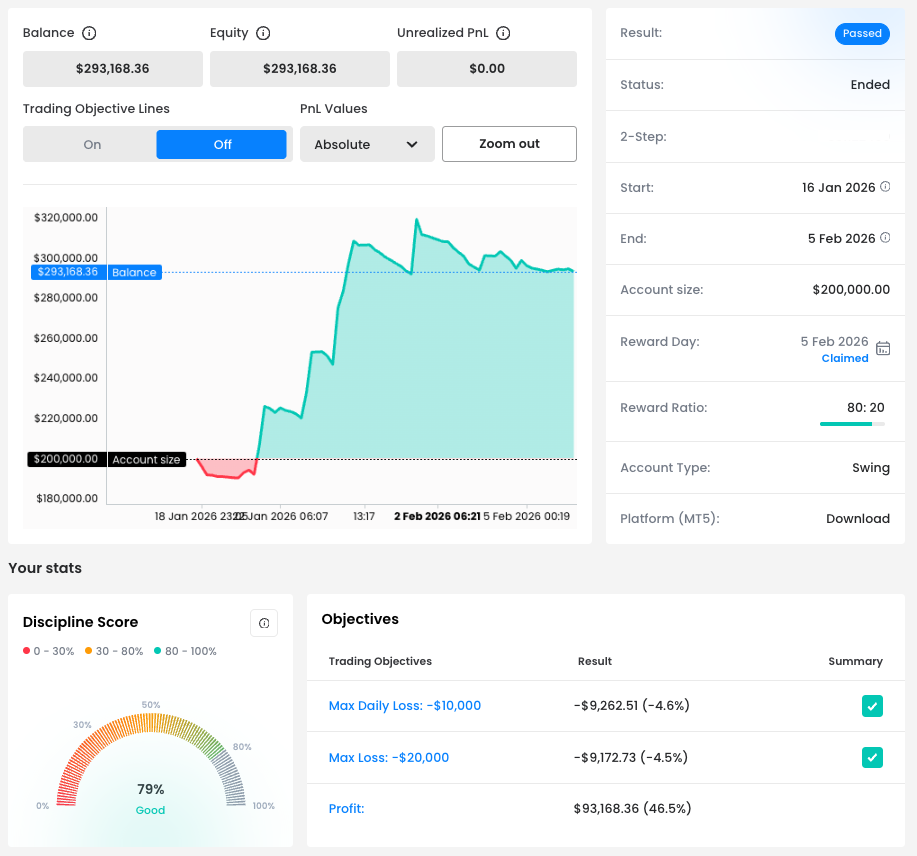
What stands out, however, is not the drawdown itself, but the response. Instead of increasing risk or forcing recovery trades, the trader remained composed. From that point onward, equity began to rise steadily, eventually stabilising well above the $290,000 level, confirming a clear shift from early instability to structured execution.

RRR Over Hit Rate
At the heart of this performance lies one number: Average RRR of 4.78. This means that winning trades were, on average, nearly five times larger than losing ones. Even with a Win rate of 30.56%, the strategy remained strongly profitable because the mathematics consistently worked in the trader’s favour.
The Most Successful Day
The most defining moment of the entire period came on Tuesday, 27 January. On that day alone, the trader generated an extraordinary $36,476.82 profit, achieved through just two trades. This single session reshaped the equity curve and accounted for a significant portion of the total performance.
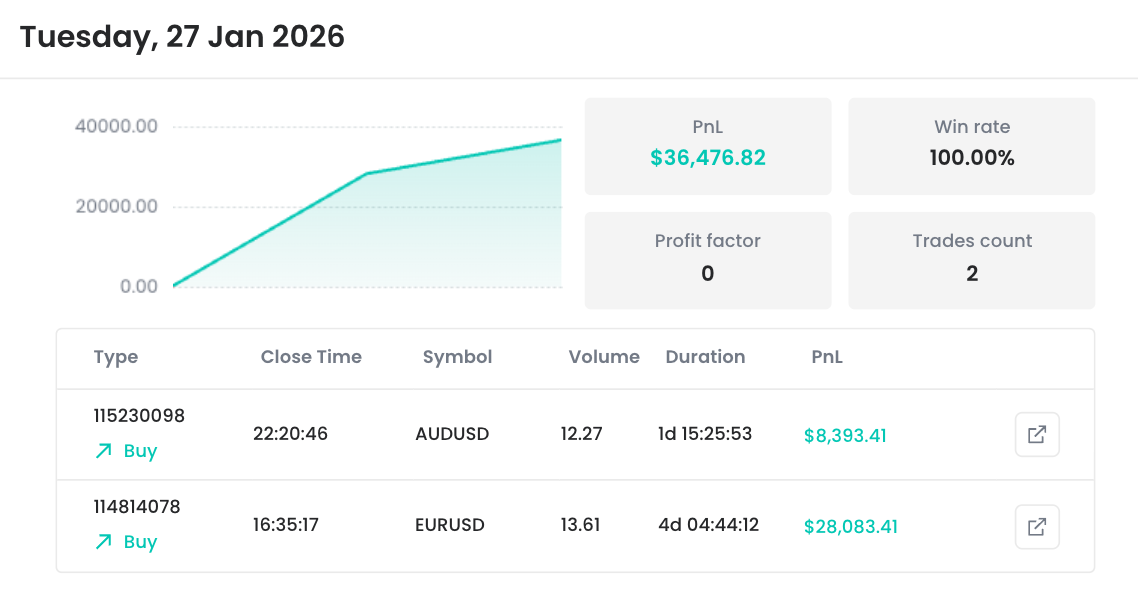
Such an outcome is a textbook example of a high-RRR approach working exactly as intended: long periods of controlled execution punctuated by outsized gains when conditions align.

Instrument Selection and Directional Bias
The Charts section reveals a trader who was flexible in strategy but selective in execution. Rather than forcing a single method, he adapted to conditions when a valid setup emerged.
The strongest results came from:
-
XAUUSD (Gold)
-
HK50.cash (Hong Kong Index)
-
EURUSD and AUDUSD (Forex)
The Buy & Sell breakdown shows that while the trader opened both long and short positions, long trades were notably more successful, suggesting a stronger ability to align with bullish momentum phases across instruments.
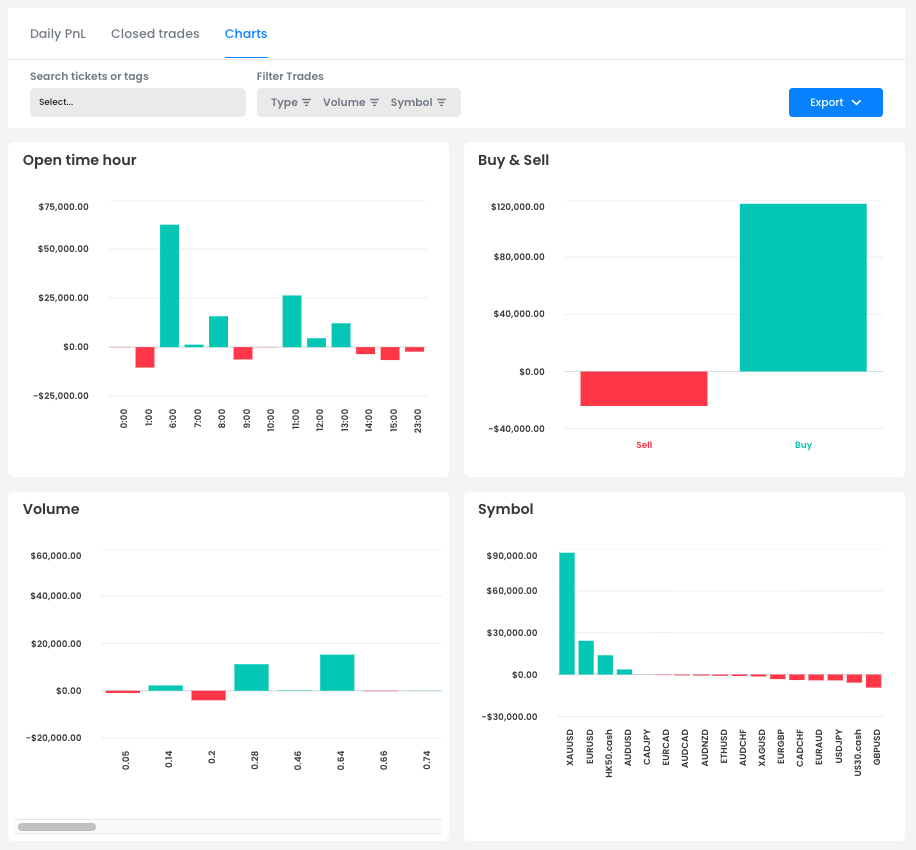
The Open Time Hour chart shows that the trader concentrated most of his profitable activity around specific hours, rather than trading evenly throughout the day. The strongest positive results cluster around 6:00, 11:00 and 13:00 platform time, while several late-day hours show smaller or negative outcomes.
These time blocks typically coincide with the European session open and the overlap between the European and early US sessions – periods when volatility increases and instruments like XAUUSD and major forex pairs often display clearer directional moves.
Case Study: When Patience Multiplies Returns
One of the most impressive trades of the period was a long position on EURUSD, which generated $28,083.41 in profit and was held for just over four days.
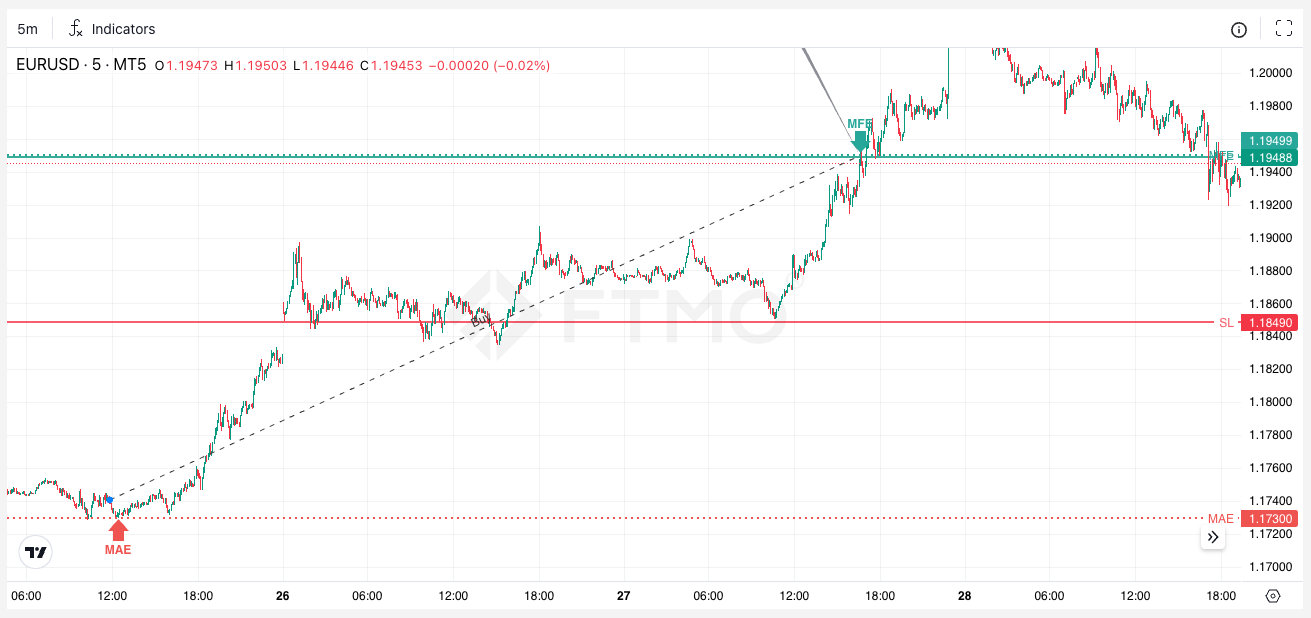
From the chart structure, several elements stand out:
-
The position evolved within a clear bullish structure, with higher lows supporting continuation.
-
The Stop Loss was actively trailed upward, reducing downside exposure as price progressed.
-
Rather than targeting a fixed Take Profit, the trader allowed the trend to unfold, adjusting risk dynamically as structure developed
This trade exemplifies professional trade management: patience during favourable conditions, protection when momentum slowed, and discipline in execution.
What This Performance Shows
This trading period is a powerful reminder that there is more than one path to profitability. By prioritising high reward-to-risk setups, remaining disciplined after early setbacks, and capitalising fully when conditions aligned, this trader transformed selective execution into a $93,168 profit in under three weeks.
Once again, this Successful Trader Story highlights that long-term results are built not on perfection, but on structure, emotional control, and the courage to let winners do the heavy lifting.
Note: Since we cannot clearly define the exact trader's strategy from the chart, this is only the private opinion of the author of this article. FTMO Traders are free to choose their strategy and as long as they do not explicitly violate our Terms and Conditions and follow our risk management rules, the choice of strategy and execution of individual trades is up to them.

This article is for informational purposes only, and some information may not reflect the current service offering or product features. Please always verify the latest terms on the official product pages.
About FTMO
FTMO has developed a two-step evaluation process to find trading talents. Upon successful completion, you may be eligible for an FTMO Rewards Account with a balance of up to $200,000 in simulated funds. How does it work?