


10 Steps to Building a Trading Strategy
Trading on financial markets requires more than just knowledge of charts and indicators. Without a clear system, even good ideas can turn into losses. That is why it is essential to have a well-thought-out plan that defines when to enter the market, when to exit, and how to manage risk. This ten-step process will help you create a strategy that is clear, testable, and sustainable in the long term.
1. Choose your trading instrument
Selecting an instrument is not only about volatility or spreads. It also helps to have a certain “trading affinity” with it. This means knowledge, experience, and ideally, a genuine interest in that market.
If you live in the USA and follow the domestic economy, it will be easier for you to trade the S&P 500 or Nasdaq. You understand the local news, you know the companies in the index, and you can anticipate the impact of US macroeconomic data.
Similarly, if you follow international trade or monetary policy, the US dollar may be a natural choice. Combined with the euro, it forms the most liquid currency pair in the world. At the same time, it reacts to the very events you may already be monitoring.
Why does this matter?
When you trade a market you know, fewer reactions will surprise you. You can process news faster, understand the “character” of price movements, and trade with greater confidence.
2. Select technical indicators
Choose indicators that measure different aspects of the market. Keep them simple, easy to read, and based on varied principles. Two indicators with the same mathematical basis rarely add value. For example, using two types of moving averages usually just repeats the same signal. A suitable combination might be:
• RSI (Relative Strength Index): Shows overbought and oversold zones and helps identify reversals.'
• MACD (Moving Average Convergence Divergence): Tracks trend direction and strength, highlighting momentum changes.
RSI reacts to short-term price extremes, while MACD monitors the broader trend. Together, they give you a balanced market perspective.
3. Set the parameters of your indicators
Default settings are tempting but often suboptimal. Each market has its own rhythm, volatility, and reaction to news. Indicators need to be fine-tuned so they fit your chosen instrument and timeframe.
Dedicate time to modifying parameters. For instance, adjust RSI sensitivity to reduce false signals in low volatility. Or change MACD settings to better capture medium-term trends.
Also, test indicators across several timeframes. A signal on H1 can behave completely differently on M15 or D1.
How can you optimise your indicators?
1. Select several parameter variants for your indicators (e.g., RSI periods 14, 21, and 7; MACD with different EMA settings).
2. Test them across different timeframes (M15, H1, D1).
3. Run each combination through backtesting – see step 6.
The goal is to find settings that provide a balanced ratio between trade success rate, RRR (risk-reward ratio), and stability of results across different market conditions.

4. Define entry and exit rules
Clearly defined entry and exit rules are the key to discipline and consistency in trading. The less room you leave for improvisation and “gut-feeling” decisions, the easier it will be to stick to your strategy and avoid impulsive trades.
Entry rules (long positions):
• RSI rising from the oversold zone (value increases from <30 upwards).
• MACD main line crossing the signal line upwards.
• Both signals should occur as close together as possible – ideally on the same candle or within 1–2 candles, confirming signal strength.
Entry rules (short positions):
• RSI falling from the overbought zone (value decreases from >70 downwards).
• MACD main line crossing the signal line downwards.
• As with long positions, signals should be synchronised; otherwise, the risk of a false entry is higher.
Exit rules:
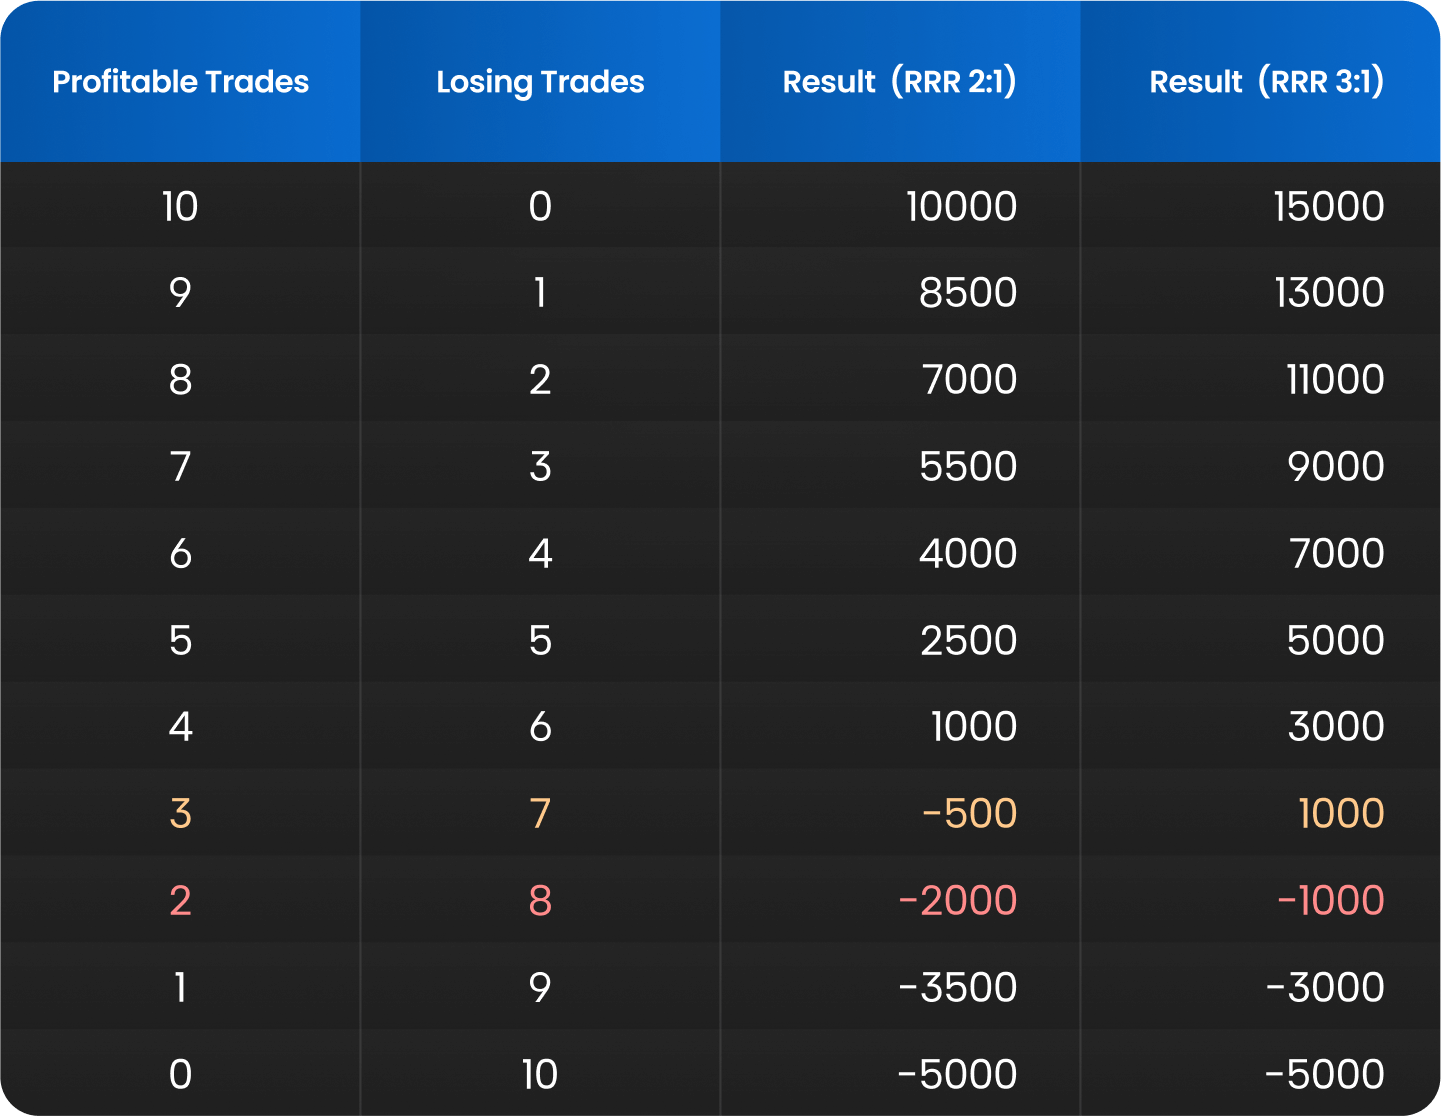
• Primary exit: achievement of a predefined take profit (TP) according to RRR – for example, with a risk of -500 USD (SL), TP is +1,000 USD with RRR 2:1 (another option is RRR 3:1).
• Alternative exit: appearance of an opposite MACD signal – the line crosses the signal line in the opposite direction to the original entry.
• Safety rule: if the signal is lost or weakens before TP is reached, the position may be closed manually, but only in line with the plan (e.g., in the event of a clear market reversal).
Why synchronise signals?
When RSI and MACD confirm at the same moment, the probability is higher that the market is truly changing direction or trend strength. If signals diverge, it often indicates market uncertainty and increases the risk of a false entry.
What are the results after 10 trades with RRR 2:1 and 3:1?
5. Determine risk per trade
Risk management is the cornerstone of successful trading; without it, even a profitable strategy can end in losses. Within the FTMO Challenge, the rules are clearly defined. For example, in a 100,000 Challenge:
• Maximum daily loss: 5% of the account → for a 100,000 USD account, that is 5,000 USD.
• Maximum overall loss: 10% of the account → 10,000 USD.
This means that if you risk too much per trade, you could breach the rules after only a few losing positions.
Why risk only a small percentage?
The recommended standard is to risk 0.25–1% of the account per trade.
• Advantages of this approach:
• Greater resilience during losing streaks.
• Psychological comfort – losses are relatively small and easier to accept.
Ability to respect FTMO limits even during tougher periods.
Practical example for a 100,000 USD account:
• Risk per trade: 0.5% of capital = 500 USD.
• Stop-loss (SL): for example, 50 points.
• Value per point: 10 USD (at 1 lot position size).
• Calculation: 50 points × 10 USD = 500 USD = exactly 0.5% of the account.
This method allows you to calculate position size for any instrument. If SL is wider (e.g., 100 points), you must reduce position size so that risk remains 500 USD.
Compliance check with FTMO limits
At 0.5% risk per trade → 10 consecutive losses = 5% account loss → still within the rules. Even with a losing streak, you avoid immediate rule violation, which is key for success in the Challenge.

6. Carry out backtesting
Backtesting shows how your strategy would have performed in the past. It is not a one-time task. You must test until the strategy works over a long period and in various conditions.
Why it matters:
A system may look great on a small sample. But when tested over 1–2 years of data, weaknesses often emerge.
Recommended approach:
1. Define goals (e.g., max drawdown 10%, win rate ≥55%, RRR ≥1:2).
2. Select at least 6 months of historical data, ideally 12–24 months.
3. Test the strategy with current settings.
4. If results fail, adjust parameters or timeframes and retest.
5. Repeat until the strategy performs consistently.
Remember: Backtesting is not about creating a “perfect past strategy”. It’s about proving resilience and stability in different markets.
7. Validate your strategy
Before risking real money (or challenge capital), you must test the strategy in live market conditions without financial risk. A free trial is the ideal environment because it allows you to:
• Observe how the strategy reacts to current market activity.
• Verify that you can follow your money and risk management in practice.
• Test technical aspects – execution speed, platform settings, and potential order-entry errors.
Tips for effective free trial trading:
• Use the same capital size as your FTMO account (e.g., 100,000 USD).
• Apply the same position size, SL, and TP as planned in live trading.
• Follow the same limit rules (max daily loss, max loss per trade).
• Keep a trading journal – after each trade, record the entry reason, exit reason, result, and emotional notes.
The aim is not only to verify profitability but also to confirm that you can mechanically adhere to your strategy without unnecessary deviations.
8. Start trading on a live account
Once your strategy proves stable on a demo account (minimum 1–2 months), you can move to live trading. Within the FTMO Challenge, discipline is essential.
Recommendations for the first month of live trading:
• Limit yourself to a maximum of 2–3 trades per day, only when strategy conditions are met – reducing impulsive trading risk and avoiding daily loss limit breaches.
• Avoid trading during major macroeconomic news releases unless this is part of your strategy.
• After reaching daily profit (e.g., 1–1.5% of the account), consider ending the trading day – protecting both capital and psychology.
9. Regularly evaluate your results
Tracking results is not just about checking account balance. The key is to measure important metrics that tell you whether the strategy is holding its performance:
• Success rate – how many trades end in profit.
• RRR (Reward to Risk Ratio) – average ratio of profit to risk.
• Drawdown – largest capital decline from peak.
• Average profit/loss per trade – shows whether profits outweigh losses.
Example after 15 trades:
• Success rate: 60%
• Average profit per trade: 800 USD
• Average risk per trade: 500 USD (RRR 1:1.6)
• Drawdown: 2%
Regular evaluations (e.g., every 2 weeks) enable you to detect problems early and adjust the strategy before losses accumulate.
10. Keep optimising
Every strategy needs to be monitored and improved. Markets evolve – volatility, liquidity, and reactions to news vary over time. Therefore, do not forget to:
• Conduct regular mini-backtests with current data.
• Check whether current RSI and MACD parameters still work. If success falls below your target, return to testing different settings.
• Adjust timeframes – signals on H1 may behave differently today than six months ago.
Testing and developing your strategy does not mean changing parameters every week. Through backtesting and monitoring, you can make small adjustments when needed and thus keep your strategy optimised.

About FTMO
FTMO developed a 2-step Evaluation Process to find trading talents. Upon successful completion you can get an FTMO Account with a balance of up to $200,000. How does it work?.