


 Available only for Windows
35 Amazing Tools
Collection of 35 powerful MetaTrader tools expert advisors, specifically crafted for aiming to enhance their trading efficiency.

Smarter & Faster Decisions
Combining cutting-edge analytics with intuitive design, App Suite empowers you to make smarter, faster trading decisions directly within your platform.

Maximise Every Opportunity
Elevate your trading performance, seize every opportunity, and stay one step ahead with the comprehensive capabilities of FXBlue’s App Suite.
Key Features &
Benefits Overview


Deeper insight into tools

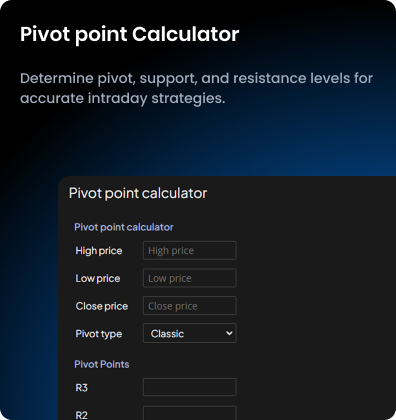
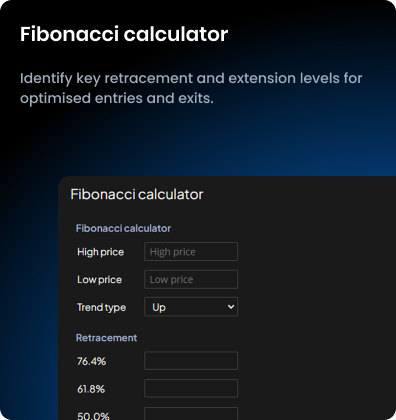
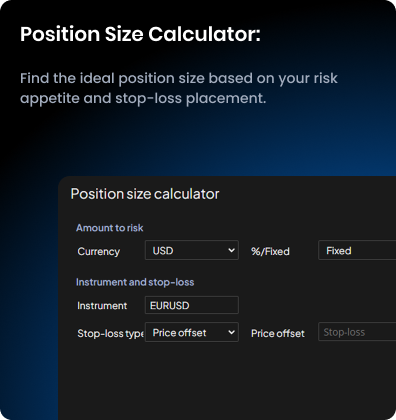
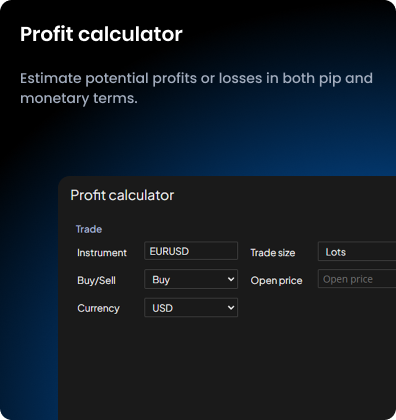
Calculators
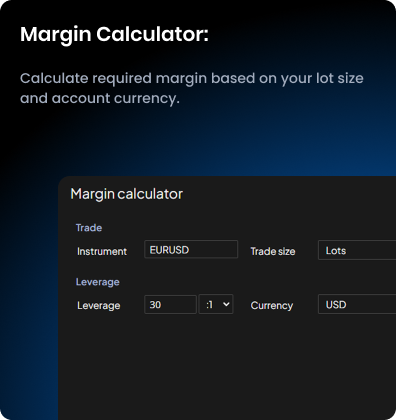
Quickly calculate pip value, margin, and potential profit or loss—all in one place. Input key trade details like lot size, entry and exit prices, and leverage to receive instant and precise financial insights.
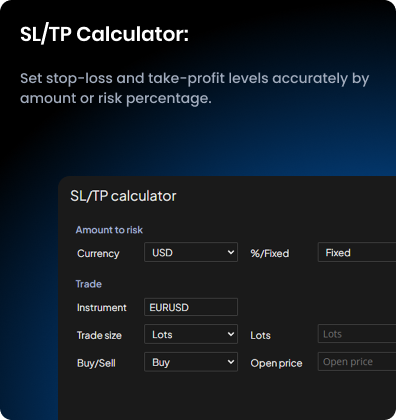
Plan your trades with confidence using the Stop-Loss and Take-Profit Calculator. Set your risk as a cash amount or percentage, and receive optimal SL and TP levels. The Risk-Based Volume Calculator ensures you never overexpose your capital.
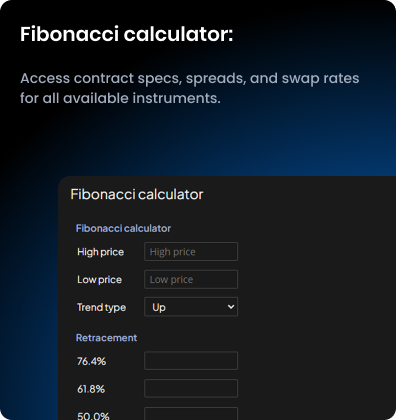
Sharpen your strategy with advanced technical levels. Use the Fibonacci Calculator to pinpoint retracements and extensions, and the Pivot Point Calculator to generate key support and resistance levels based on your preferred method.
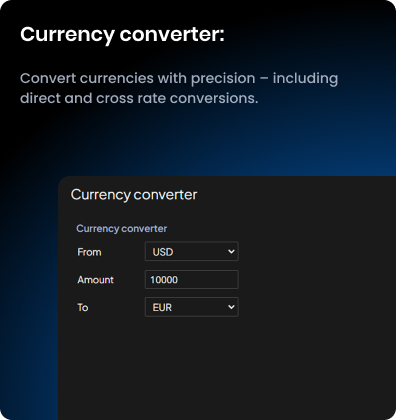
Stay in control when trading across markets with the integrated Currency Converter. Access real-time exchange rates to calculate conversions accurately and effortlessly—no need for external tools.
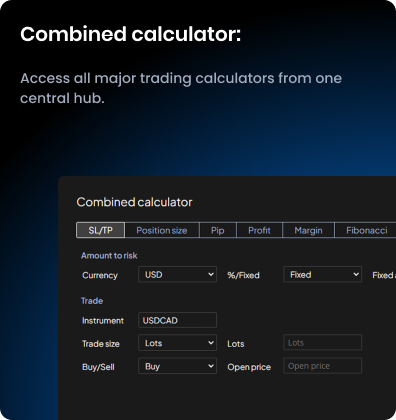
No more jumping between tools. The Combined Calculator brings together every essential trading metric—fast, reliable, and all in one tab—so you can focus on what matters: making informed decisions with clarity and speed.
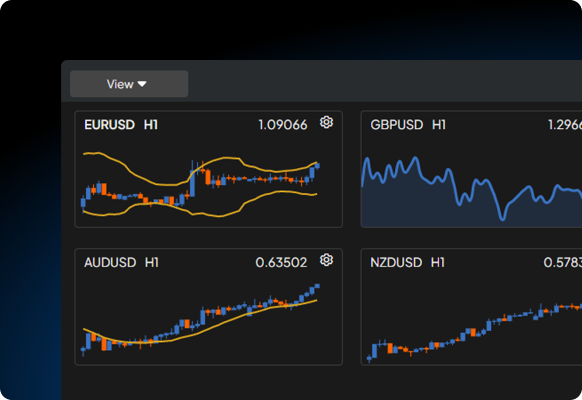
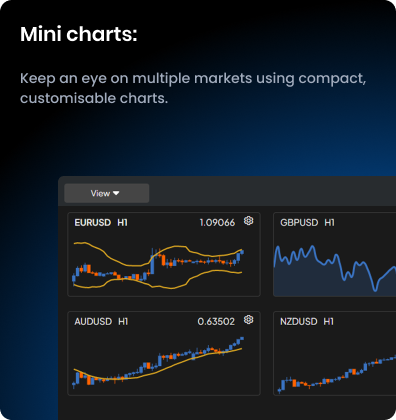
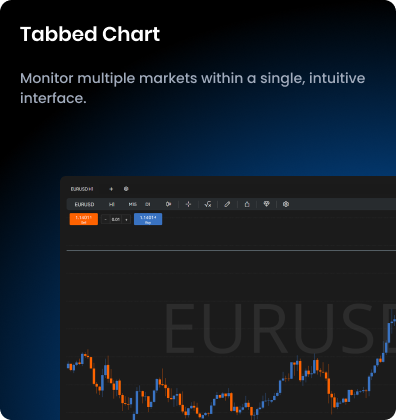
Mini Charts
Monitor several markets at once with a compact layout optimised even for mobile use. Stay alert to opportunities without switching screens or losing focus.
Quickly switch between watchlists and adjust timeframes on one or all charts. Choose the chart style that suits you—line, candlesticks, or bars—for clearer market insights.
Enhance your analysis with integrated indicators like Moving Averages, Keltner Channels, and Parabolic SAR. Spot trends, reversals, and key levels with ease.
Save your settings for indicators and chart styles to ensure a consistent workflow. Reload your preferred configurations instantly for efficient trading across markets.
Use Mini Charts alongside tools like the Market Scanner or Fibonacci Calculator. Combine insights to strengthen entry and exit decisions for more confident trading.
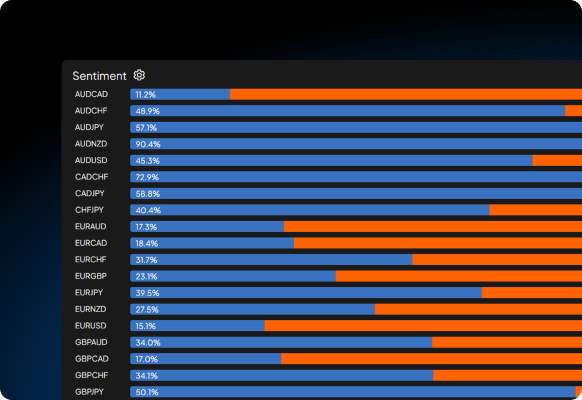
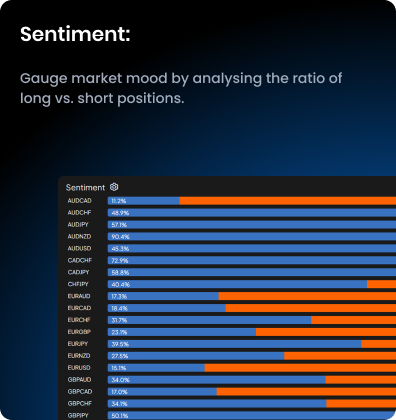
Trader Sentiment
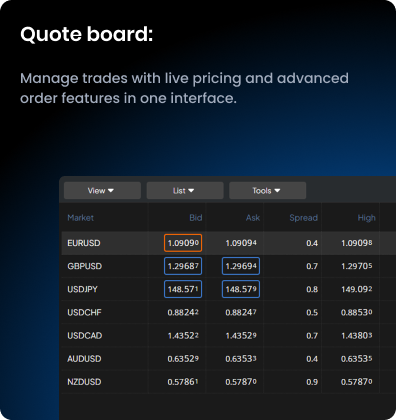
Track the real-time percentage of traders holding long and short positions. Instantly understand the mood of the market—for example, when 57.6% of traders are short on EUR/USD.
Choose how sentiment data is displayed. Switch between bar charts and gauges to suit your preferred style of analysis and ensure clarity at a glance.
Focus on a single currency across pairs for consistent insight. Easily convert views like GBP/USD to USD/GBP to align all data in one direction for better comparison.
Sort sentiment by bullish or bearish strength to highlight the most extreme positions. Identify potential setups faster by spotting imbalances in trader positioning.
Use sentiment to confirm trends or spot potential reversals.
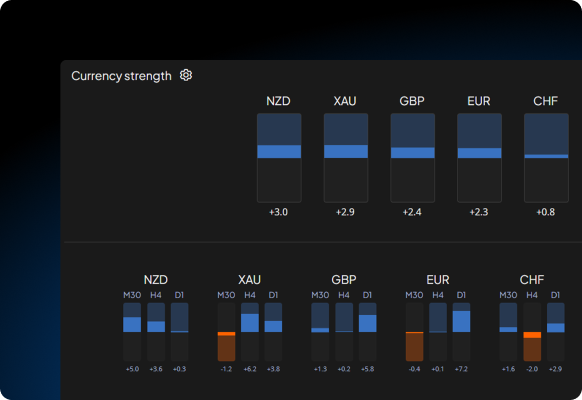
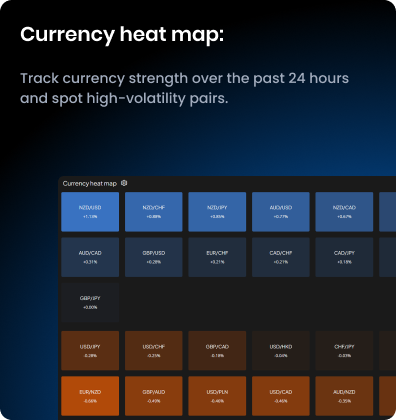
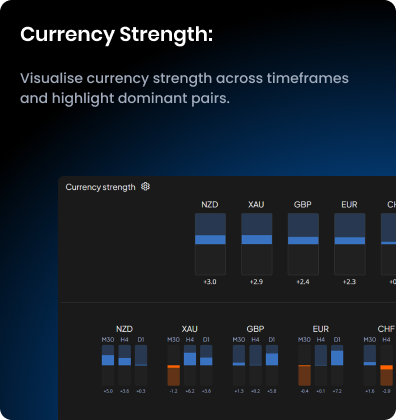
Currency Strength
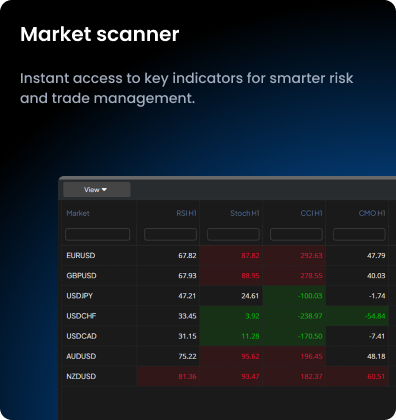
Instantly identify the strongest and weakest currencies using a clear visual overview. Stay aligned with current momentum across the FX market.
Set your preferred base currency to view all strengths and weaknesses in a unified direction—perfect for consistent comparison and clearer strategy building.
Switch between different timeframes to assess both short-term and long-term strength dynamics. Ideal for intraday or swing traders.
Use colour-coded heatmaps and dynamic bar charts to spot shifts in strength at a glance. No need to analyse each pair manually.
Combine strength insights with sentiment, scanner, or mini charts for a well-rounded trading decision. Precision meets simplicity.
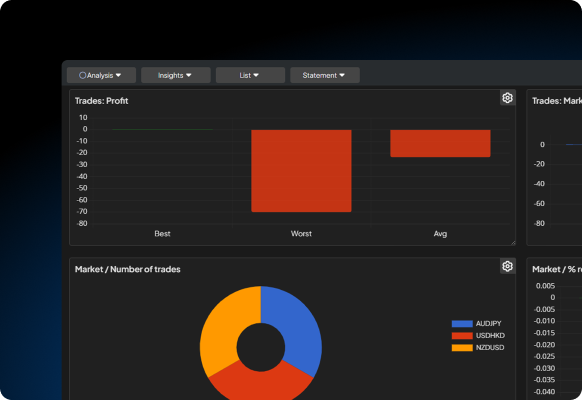
Account History
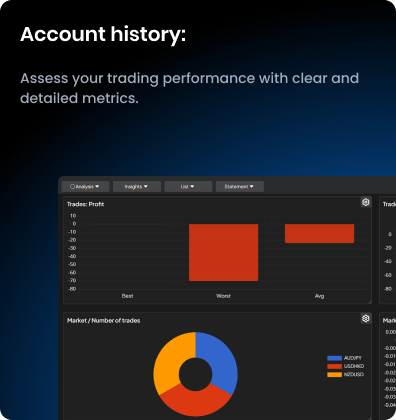
Track your account balance over time with an interactive line chart. Quickly identify deposit patterns, drawdowns, and growth trends to assess your overall performance.
See which trades and instruments delivered your best and worst results. Use bar charts and market-based summaries to understand where your edge lies—or doesn’t.
Explore your buy vs. sell distribution and assess performance based on trade duration. Discover whether short or long holds work best for you using visual time-in-trade metrics.
Understand your win/loss ratio instantly with clear, colour-coded charts. Use the duration vs. profit scatter plot to spot patterns across different markets and timeframes.
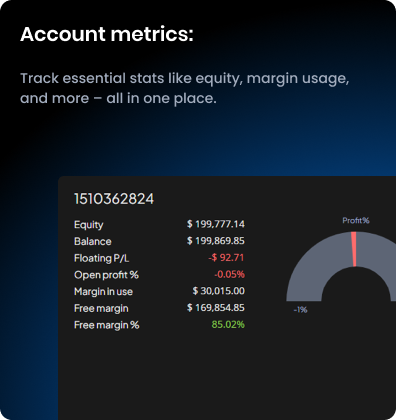
Access a complete table with key metrics by day, week, month, or year. Combine raw figures with high-level analytics to uncover consistent habits, mistakes, and opportunities.
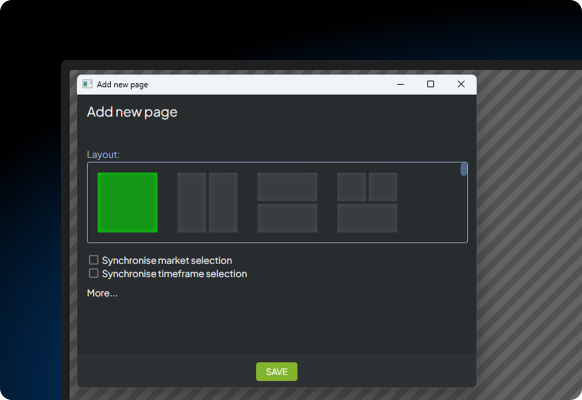
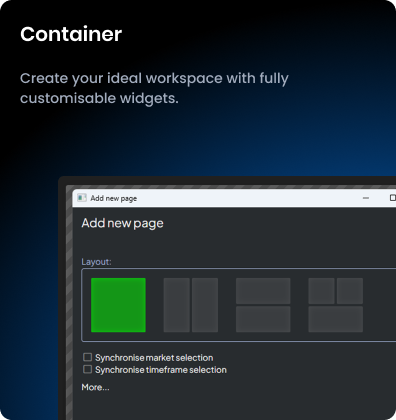
Container
Design your ideal trading workspace with a range of layout options. Arrange widgets to match your strategy and keep everything where you need it—no clutter, no compromise.
Easily add widgets by clicking on empty slots, and resize them by dragging borders. Everything is built for smooth, user-friendly interaction.
Link markets and timeframes across widgets for unified analysis. Change the market in one panel and see updates reflected throughout your dashboard automatically.
Double-click to modify layout settings or reassign market links in seconds. Keep your setup fluid and adaptable to changing trading needs.
Switch between configurations effortlessly. Replace widgets without affecting layout, and maintain a streamlined, personalised trading environment at all times.