


Want to invest in the US economy? Try the S&P 500 Index
Instruments linked to US equity indices belong to the most popular and the most traded ones worldwide (and FTMO Traders are no exception). One of the most well-known indices, covering most of the market capitalisation in the US, is the S&P 500 index, which will be discussed today.
S&P 500 is not the most famous stock index in the US; such honour belongs to its older "brother", Dow Jones Industrial Average. However, the DJIA is far from being the best indicator of what is happening in the US stock market. If you want to get a truly complex picture, S&P 500 does a better job.
The companies included in the index represent more than 83% of the market capitalisation in the US. Moreover, this index is one of the indices to which most investment instruments are linked. The S&P 500 is the underlying benchmark for more than USD 13,5 trillion in assets and has nearly USD 5,4 trillion of passive index instruments directly linked to it (at the end of 2020).
Wells Fargo and American National Bank launched the first mutual fund for institutional investors to track the S&P 500 in 1973. The first mutual fund for retail investors tied to the S&P 500 was launched in 1976 by Vanguard under the name Vanguard First Index Investment Trust, now the Vanguard 500 Index Fund. Then in 1993, the first ETF with the S&P 500 Index as an underlying asset was created called Standard and Poor's Depository Receipts, now known as the SPDR S&P 500 Trust ETF (known by its acronym Spider).
Although it is one of the most well-known indices, a lot of false information is circulating about it. For example, it is not true that the index brings together the 500 largest companies in the U.S. Rather, it focuses on leaders in all sectors and industries (according to the Global Industry Classification Standard, there are 11 sectors, which are further divided into 24 industry groups of 69 industries and 158 sub-industries), thus occupying the entire industry spectrum in the US stock markets virtually.
History
It is also not entirely true that the index was created in 1957. The predecessor of Standard and Poor's founded in 1923 compiled several indicators that tracked 26 industries and 233 stock titles weekly. In 1926, the S&P 90 Composite Index was created, comprising 50 industrial companies, 20 railroad companies, and 20 utilities. In 1941, the number of stocks in the first composite index was expanded from 233 to 416, and together with the S&P 90 index, their original value was recalculated to a starting point of 100 points as of 1935 and 1939, respectively.
Standard and Poor's was formed in 1941 when Standard and Poor's Statistical Co. and Poor's Publishing Co. merged. As early as 1860, businessman Henry Varnum Poor had published a book, "History of Railroads and Canals in the United States," which sought to provide investors with a comprehensive view of the operation of the then rapidly developing railroads. Together with his son Henry William Poor, they founded the H.V. and H.W. Poor Co., which published annually updated versions of "Poor's Manual of the Railroads of the United States" and "Poor's Directory of Railway Officials". The Standard Statistics Bureau was founded in 1906 by Luther Lee Blake to provide investors with information on companies outside the railroad industry.
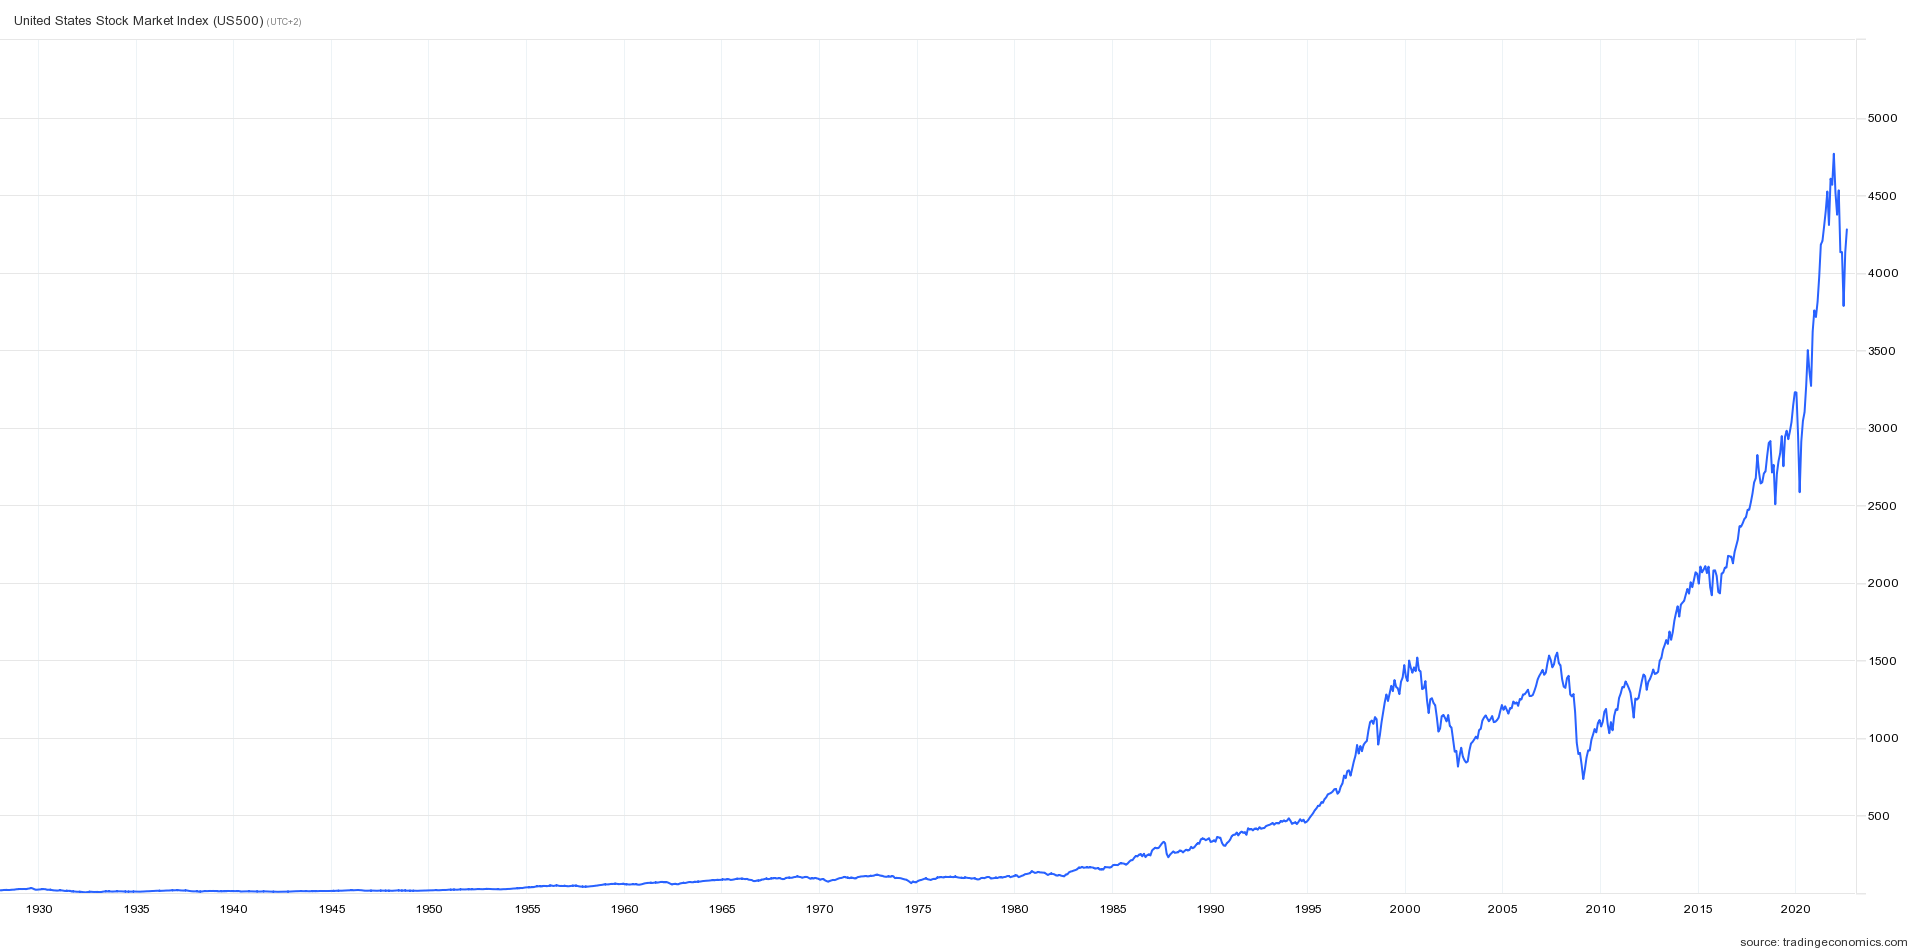
On March 4, 1957, the number of companies in the first composite index was expanded to 500, creating the S&P 500 index, which was calculated on an intraday hourly basis. To maintain a long and continuous time series, the S&P 90 index was chosen as the base, with data now officially available back to 1928 daily and to 1926 weekly.
This was a rather revolutionary step in the field of stock indexes, as the index was calculated by a new electronic method from Melpar, which allowed tracking all companies on the NYSE. But not all titles were liquid enough at the time, so the index's authors, Lew Schellbach and George Olsen, selected 500 companies that would best represent the entire US stock market.
Composition
Initially, the industrial sector represented the majority of the index (425 firms), with 60 firms in the utility sector and 15 railroad companies. The composition of the index did not change until 1976. In that year, financials were added to the index for the first time, but the majority were industrial giants even then. From 1988 onwards, the strict sectoral classification no longer served its function, as changes in the economy were very rapid. Since 1989, the index's composition can be changed as often as necessary (currently done quarterly), and the last change was on June 8 and June 21, 2022.
The S&P 500 was also the first equity-weighted index (today, this method of measuring the weighting of individual titles, which depends on the market value of companies, is quite common); since 2005, the index has been weighted based on the volume of stocks freely available to investors in the market (so-called float-adjusted). This category does not include stocks held by strategic investors that do not make it to the market, but only those that are theoretically freely available.
The committee decides the composition of the index on the basis of several criteria. The committee meets on monthly basis and, among other things, assesses the companies that could be included in the index. At the same time, it tries to keep the turnover of the included companies to a minimum. For example, companies in the index must be US companies (foreign companies were allowed to be in the index until July 2002), have a total market capitalisation of at least USD 14.6 billion, have a certain proportion of free float, meet liquidity conditions, etc.
S&P Dow Jones Indices, a subsidiary of S&P Global, handles the updating (which takes place every second) and disseminating of the index data. If an investor or trader wants to invest in stocks and is looking for a tool that covers most of the companies in the world's largest economy, the S&P 500 Index may be an excellent tool for them. Investors can capitalise on the growth of the most influential stocks traded on the NYSE, NASDAQ and CBOE through one tool, and FTMO traders can also capitalise on their declines through a leveraged CFD under the ticker US500.cash. Given the low spreads and zero commissions (which apply to all index instruments), it is no wonder that it is one of the very popular instruments among FTMO traders today.
About FTMO
FTMO developed a 2-step Evaluation Process to find trading talents. Upon successful completion you can get an FTMO Account with a balance of up to $200,000. How does it work?.