


Trading Week Ahead: EURUSD at Make-or-Break Support Ahead of NFP
As markets brace for a pivotal week, traders are eyeing three major catalysts: President Trump’s speech, JOLTS job data, and the all-important Nonfarm Payrolls report. With political tensions rising and economic uncertainty looming, each event could stir sharp price action across FX, indices, and bonds.
• President Trump Speaks
President Trump is set to speak on Monday evening, with his remarks coming at a critical time as the US faces the looming threat of a government shutdown. Markets will closely monitor his stance on fiscal policy, the Fed, and budget tensions. Any signals of political instability or pressure on the central bank could trigger swift volatility across USD pairs and equity indices
• JOLTS Job Openings
Labour market momentum comes into focus on Tuesday with the latest JOLTS data (previous: 7.18M, forecast: 7.15M). A notable decline in job openings could signal softening demand, increasing the case for rate cuts. However, resilient figures would support the Fed’s hawkish bias and lend strength to the dollar.
• Nonfarm Payrolls
Friday’s NFP report (previous: 22K, forecast: 51K) arrives during rising political uncertainty. If a shutdown hits, the market will focus even more on economic data. Strong payroll growth might delay rate cuts and lift the dollar, while weaker figures could boost risk appetite and weigh on the greenback.
| Date | Time | Instrument | Event |
|---|---|---|---|
| Monday, Sep. 29 | 4:00 PM |  USD USD |
Pending Home Sales |
| 7:15 PM | USD |
President Trump Speaks | |
| Tuesday, Sep. 30 | 3:30 AM |  CNY CNY |
Manufacturing PMI |
| 6:30 AM |  AUD AUD |
Cash Rate | |
| 8:00 AM |  GBP GBP |
GDP | |
| 2:00 PM |  EUR EUR |
German CPI | |
| 4:00 PM | USD |
JOLTS Job Openings | |
| Wednesday, Oct. 1 | 11:00 AM | EUR |
CPI |
| 2:15 PM | USD |
ADP Non-Farm Employment Change | |
| 4:00 PM | USD |
ISM Manufacturing PMI, Prices | |
| Thursday, Oct. 2 | 8:30 AM |  CHF CHF |
CPI |
| Friday, Oct. 3 | 2:30 PM | USD |
Average Hourly Earnings |
| USD |
Nonfarm Payrolls | ||
| USD |
Unemployment Rate | ||
| 4:00 PM | USD |
ISM Services PMI |
*All times in the table are in GMT+2
Technical Analysis with FVG Strategy
This trading approach leverages the 20- and 50-period Exponential Moving Averages (EMAs) to assess the prevailing market trend, while the Fair Value Gap (FVG) is used to pinpoint zones of price inefficiency. These gaps, formed during sharp price movements, often highlight optimal entry or exit levels. The strategy is suitable for instruments like EURUSD, GBPJPY, US30, and XAUUSD and provides insights into both last week’s market opportunities and the current one.
Opportunities to Watch This Week
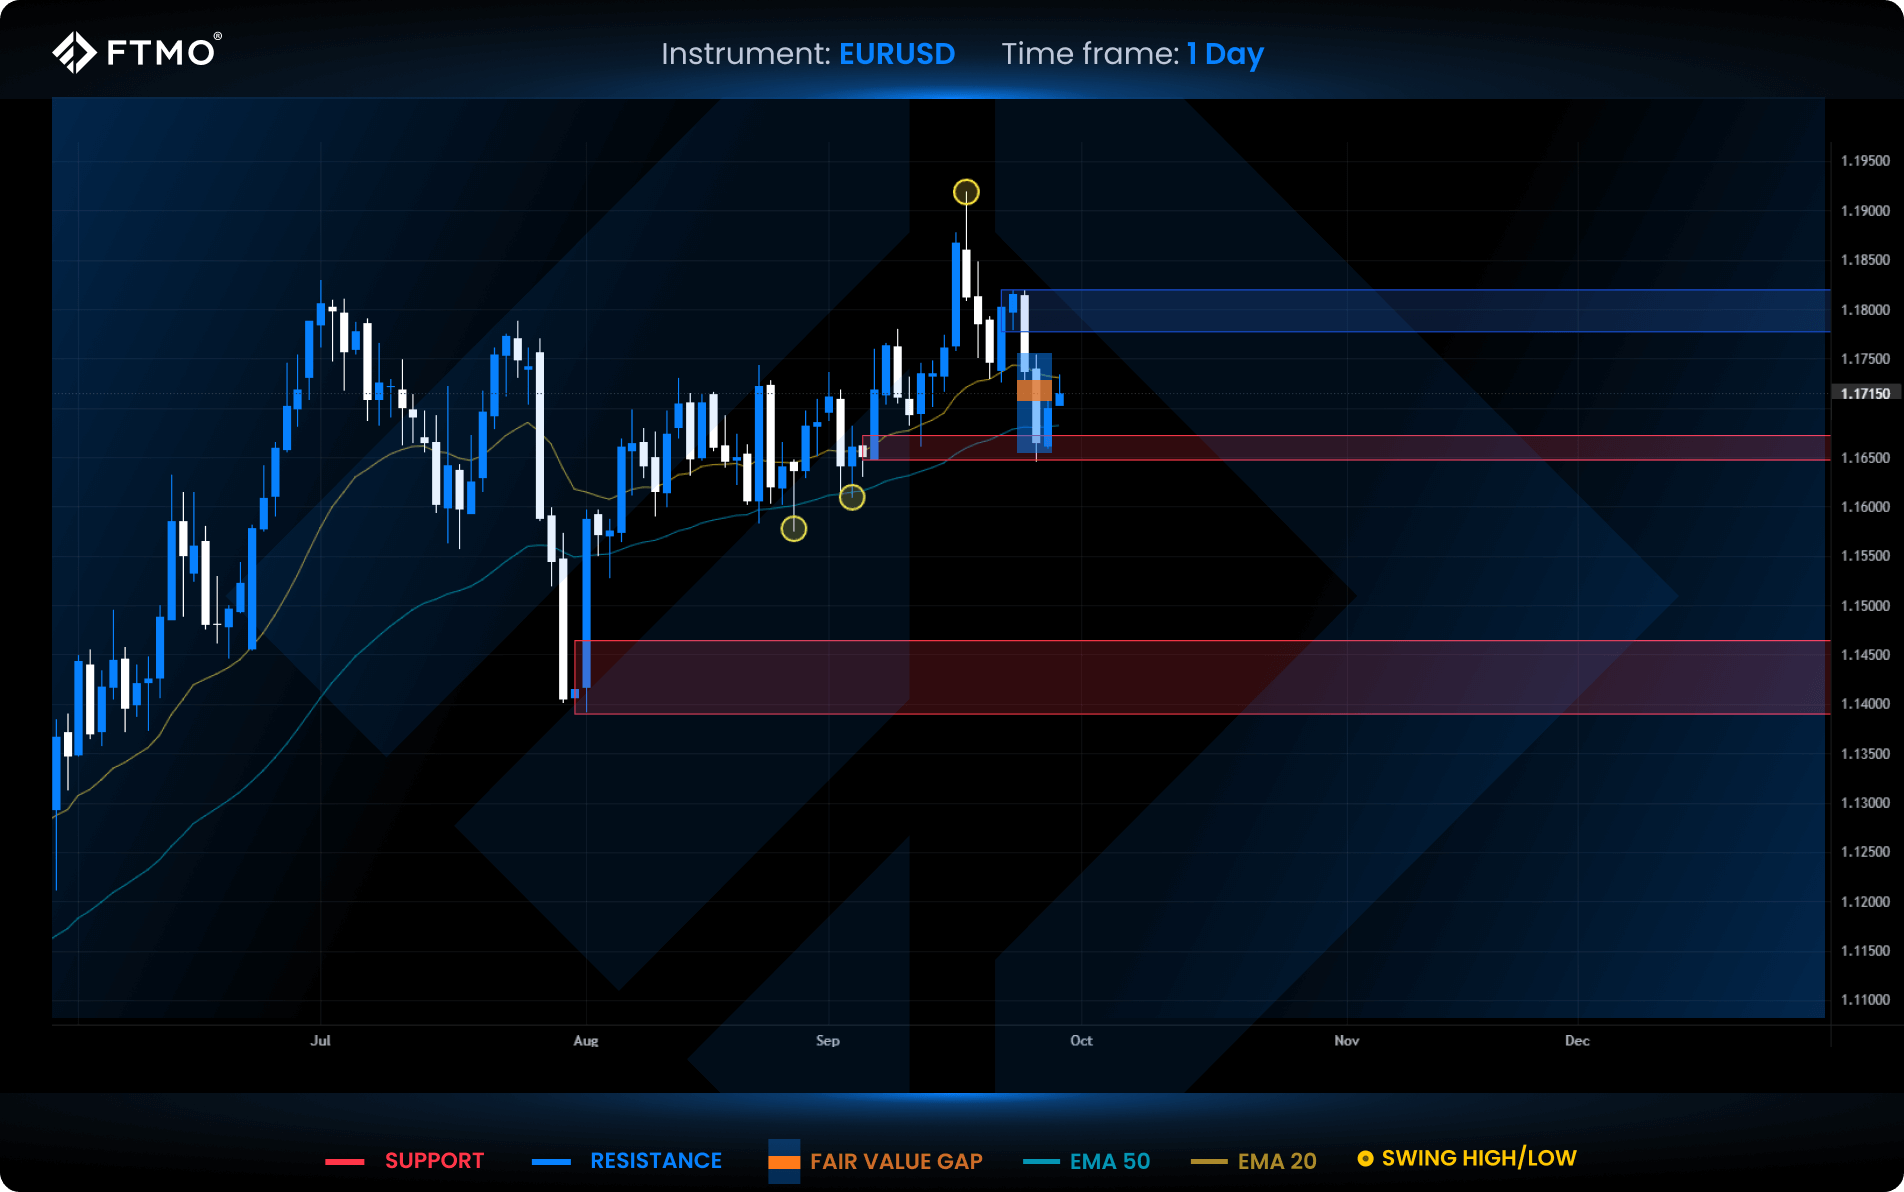
EURUSD
Market Context: EURUSD sold off sharply last week, reaching a key support level aligned with a prior Fair Value Gap (FVG). Price reacted with an inside bar, signalling a possible shift in momentum, though bearish pressure remains intact.
Bearish Scenario (Preferred): Continuation from the newly formed FVG favours further downside toward the next liquidity zone. Sellers maintain the edge unless support triggers a decisive reversal.
Bullish Scenario (Alternative): A confirmed bounce from support could fuel a retracement toward nearby resistance.
Setup: A fresh bearish FVG has formed this week, offering potential entry for short setups. Still, the proximity to strong support warrants caution.
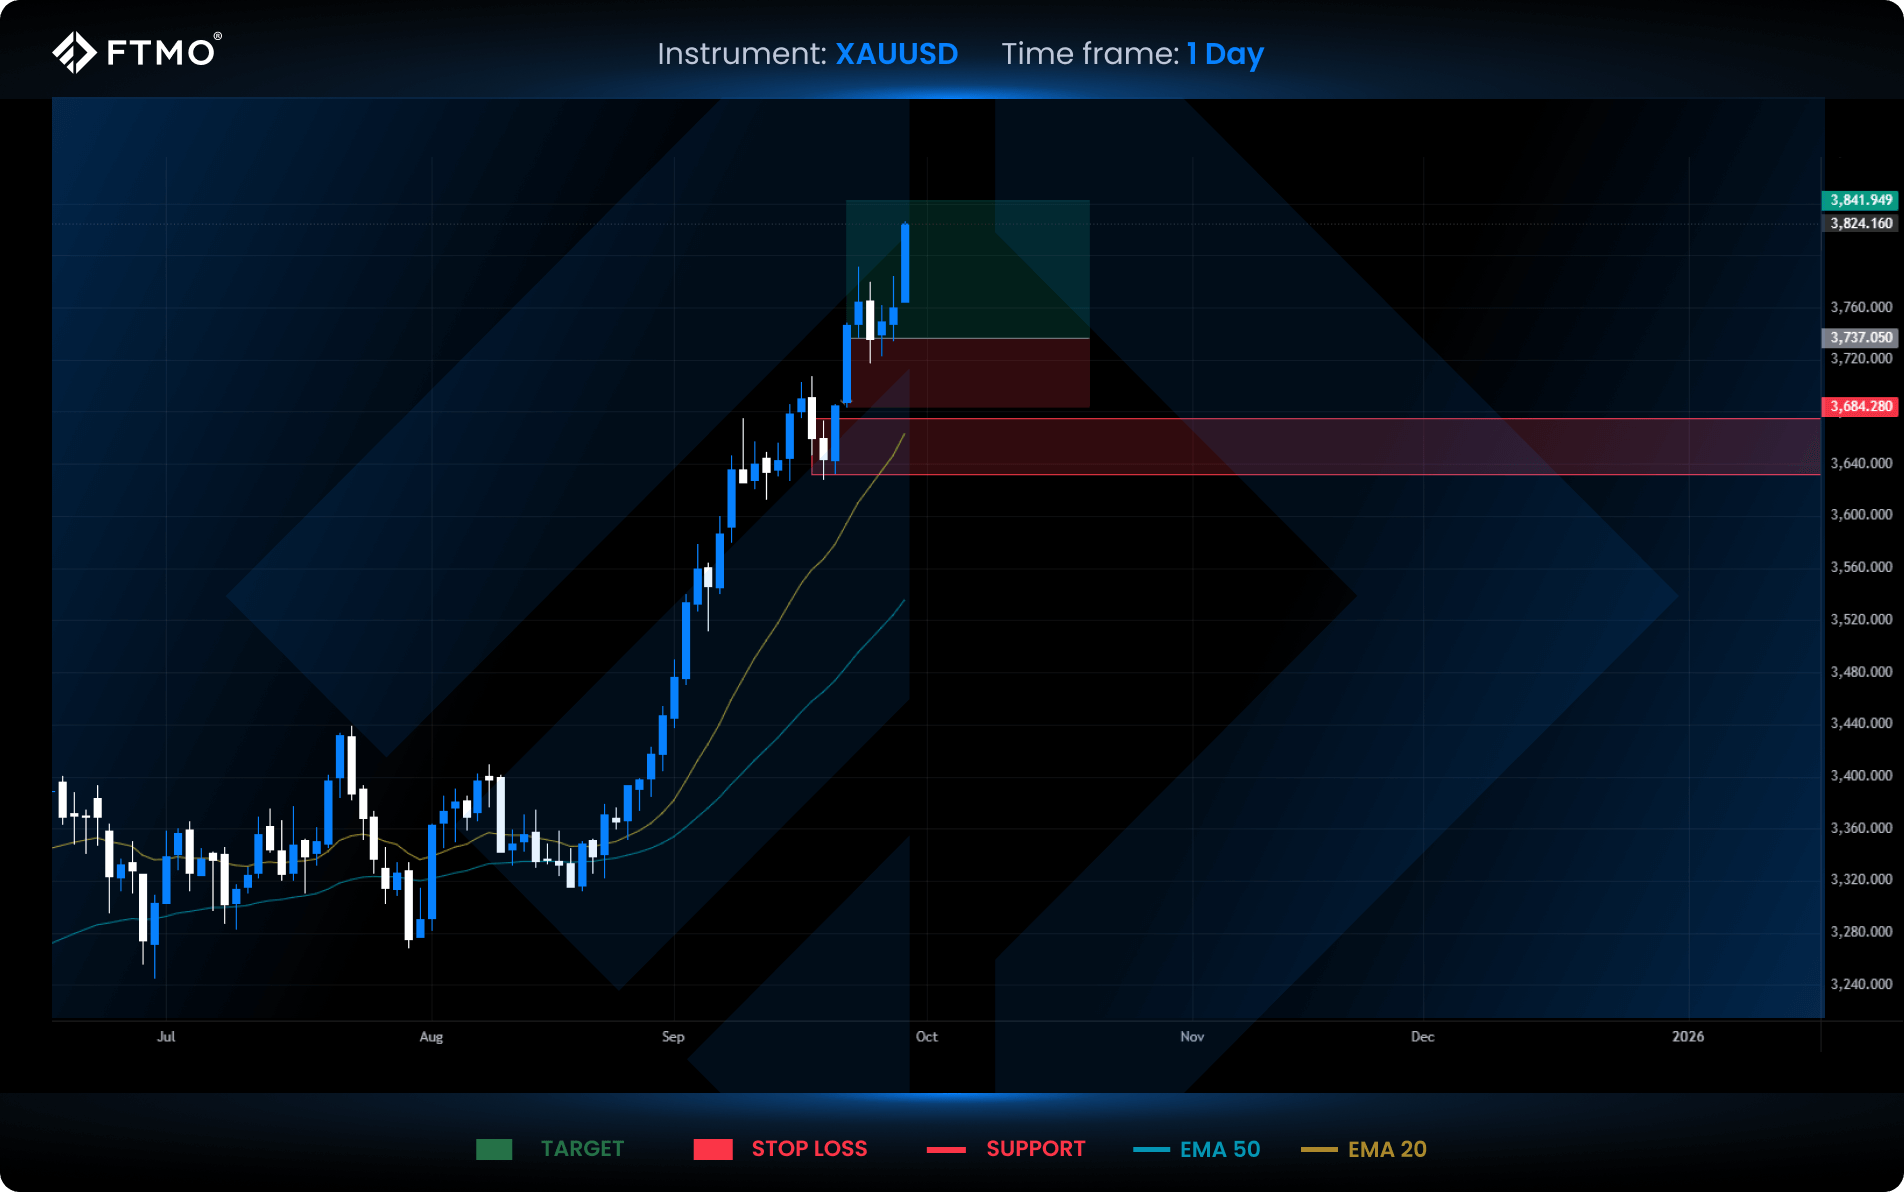
XAUUSD
Market Context: Gold continues to trend higher, consistently responding to FVG zones acting as support. The broader structure remains bullish, supported by trend and momentum.
Bullish Scenario (Preferred): As long as the structure holds, further upside is expected. FVG levels serve as reliable dip-buying zones, with the trend aiming toward new highs.
Bearish Scenario (Alternative): A short-term correction could occur if buyers show signs of exhaustion. Look for a large candle with high volume to signal a temporary reversal.
Setup: The bullish FVG formed last Tuesday remains in play, with a 2:1 RRR target still valid. No new gaps have emerged this week.
Last Week’s Opportunities
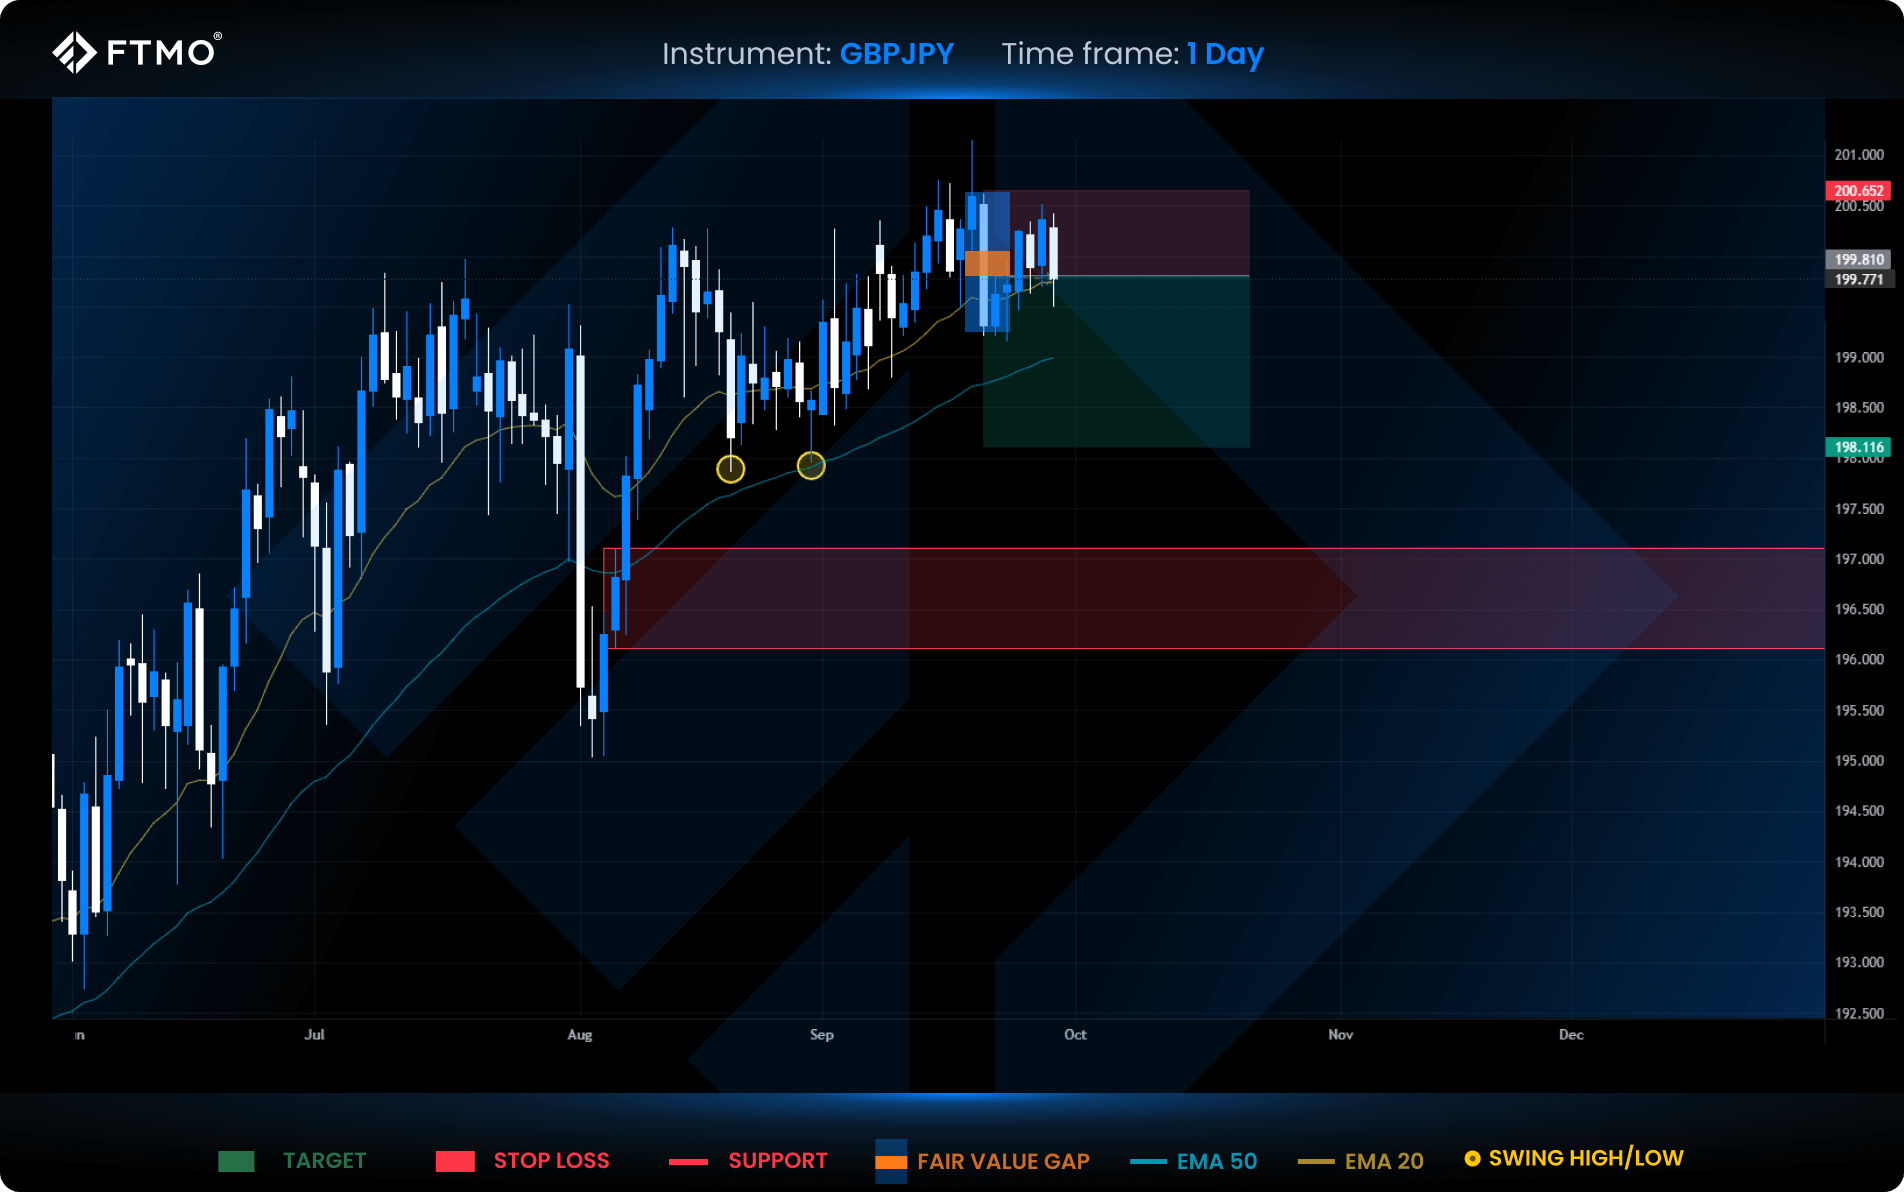
GBPJPY
Market Context: GBPJPY is currently trading within a previous FVG zone, suggesting room for a downside correction. However, dynamic support from the 20 and 50 EMAs continues to hold, adding complexity to the setup.
Bearish Scenario (Preferred): If the price rejects the FVG area, it may slide toward swing low liquidity or the broader support zone below.
Bullish Scenario (Alternative): A sustained reaction off the EMAs could attract buyers, potentially lifting the pair back toward recent highs. Monitor for bullish confirmation near those moving averages.
Setup: No new FVG was formed this week, but last week’s bearish setup remains active and valid.
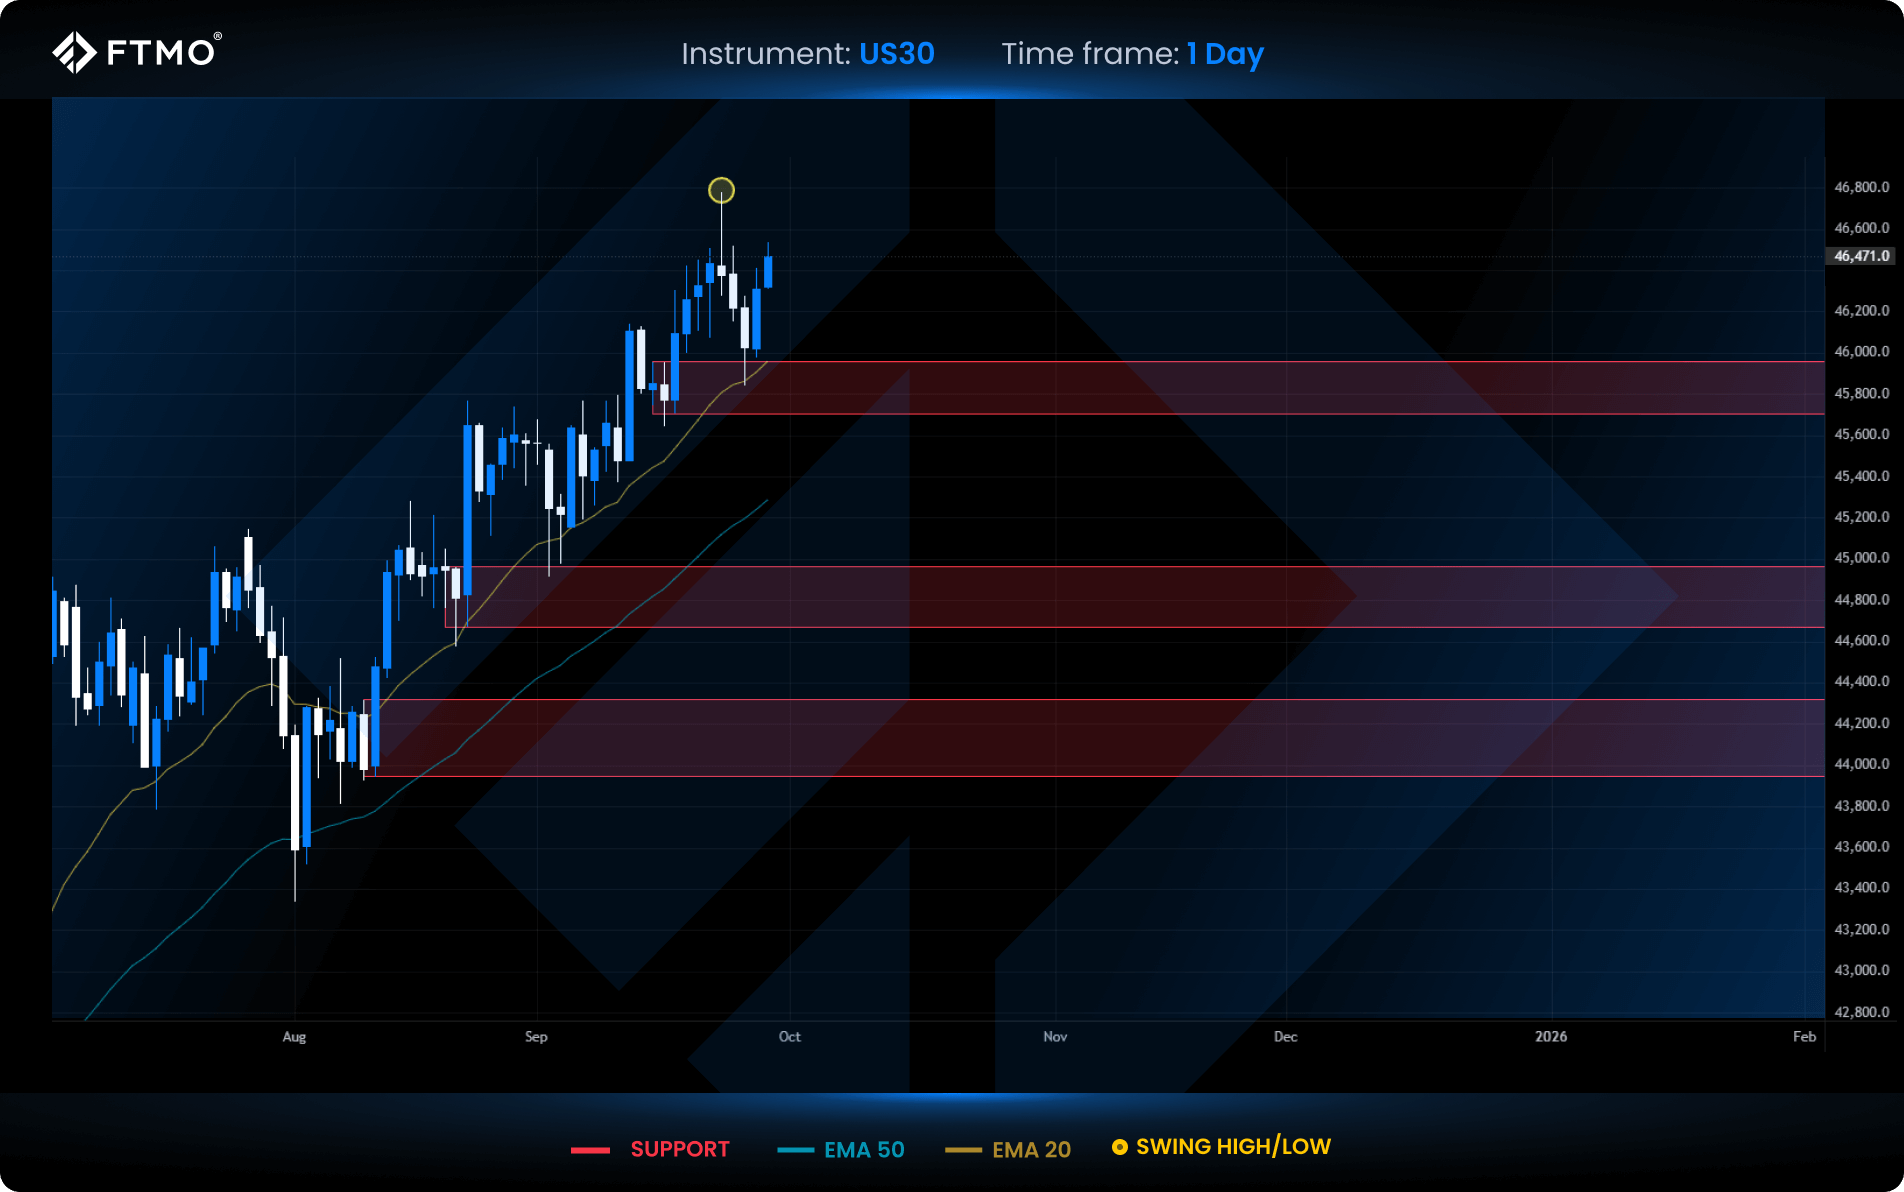
US30
Market Context: US30 rebounded strongly from a marked support zone last Thursday, reinforcing its broader bullish structure. The index now eyes all-time highs, supported by a continuation in upward momentum.
Bullish Scenario (Preferred): If momentum persists, price is likely to test the ATH liquidity zone. Structure supports a continuation higher as long as recent gains hold.
Bearish Scenario (Alternative): A pullback toward the support zone remains a possibility before another bullish leg. Watch for signs of exhaustion or distribution near highs.
Setup: No new FVG has formed this or last week. Current price action is structure-driven rather than gap-driven.
All information provided on this site is intended solely for educational purposes related to trading on financial markets and does not serve in any way as a specific investment recommendation, business recommendation, investment opportunity analysis or similar general recommendation regarding the trading of investment instruments. FTMO only provides services of simulated trading and educational tools for traders.
About FTMO
FTMO developed a 2-step Evaluation Process to find trading talents. Upon successful completion you can get an FTMO Account with a balance of up to $200,000. How does it work?.