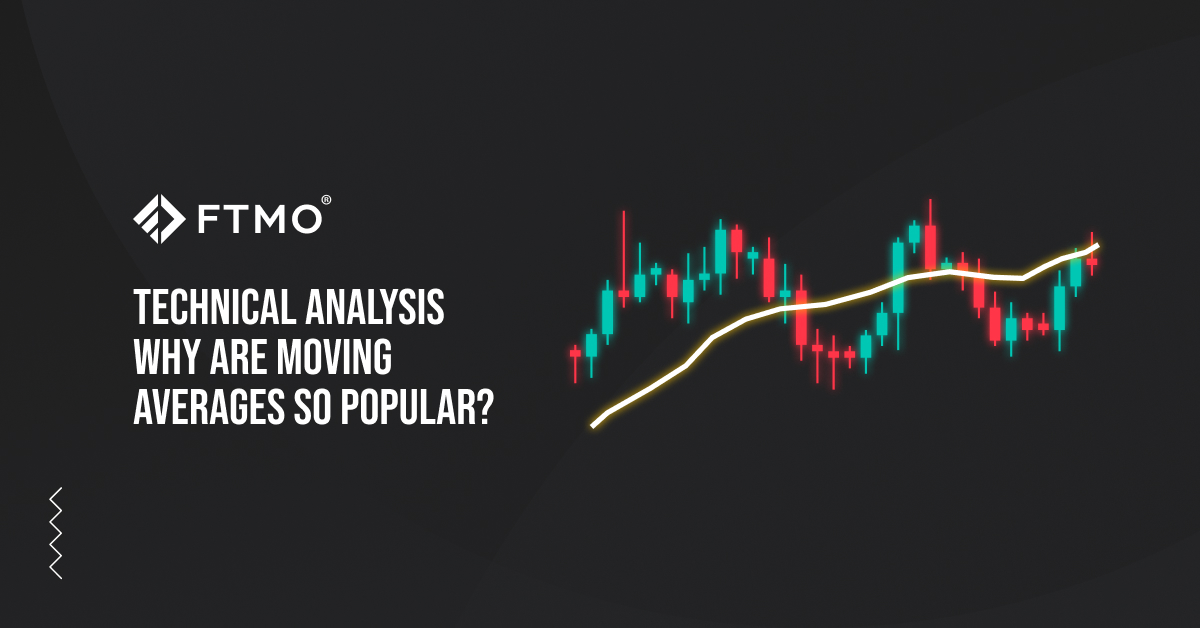
Technical analysis - why are moving averages so popular?
In our series on technical analysis, we will describe some of the most famous technical indicators that traders use for trading. Today, we will look at moving averages, which are among the simplest and most popular trend indicators.
Moving averages (MAs) are some of the simplest indicators, the functions of which can be easily understood by anyone. This is perhaps why they are so popular among novice traders and those who are just getting acquainted with forex trading and building a trading strategy.
They help to identify a trend or its change while smoothing out extreme market fluctuations. Any price (opening, closing, maximum, minimum) or volume can be used as a basis for their calculation. Thus, the simplest way of applying moving averages is to monitor the relationship of the indicator with the price, where a price rise above the moving average generates a buy signal and a price fall below the indicator is a sell signal.
Four types of moving averages are most commonly used in technical analysis, simple, linearly weighted, exponential and smoothed, which differ in how they are calculated and the weight they give to current or older values. The Simple Moving Average (SMA) applies the same weight to all prices. The Exponential Moving Average (EMA) and the Linear Weighted Moving Average (LWMA) assign more weight to the most recent prices. Finally, the Smoothed Moving Average (SMMA) is a special exponential average that takes into account a more extended time period.
FTMO Traders who use cTrader to trade can also use the Hull Moving Average (HMA), developed by Allan Hull. Compared to a SMA, it almost completely eliminates lag while improving smoothing. Another type of MA available to traders in cTrader is the Triangular Moving Average (TMA), which applies more weight to prices in the middle of the selected period.
On the one hand, having so many types of MAs may seem like an advantage because traders can choose the one that best suits their strategy ; on the other hand, it shows one of the disadvantages of moving averages. This is because they give investors delayed signals and fail to identify tops and bottoms of trends early enough.

In the picture above, we see five different moving averages with the same period (50), and it is pretty clear that each of them gives traders signals at different times and different prices (triangular - yellow, simple - light blue, weighted - red, exponential - green and Hull - purple). The triangular MA gave the fewest signals during this period, while the Hull MA generated the most signals.
When traders want the MA to give them signals more often and not to lag too much, they can specify a shorter period (the number of periods that count in calculating the moving average). In the figure below, we see an hourly chart of the GBPUSD currency pair with an exponential moving average with a period of 21.

On the other hand, those traders who want to avoid a lot of false signals can choose an MA with a more extended period. In the following picture, we see the same currency pair, but this time with an EMA with a period of 200. As you can see, the number of signals has significantly decreased. The moving average, in this case, serves as an indicator of a longer trend and also replaces the trend line or resistance level (if the price gets above the moving average, it can act as support).

More often, however, traders use a combination of several moving averages with different periods and their crosses (or combine them with other indicators), which can provide even more interesting entry opportunities. Thus, a moving average with a longer period identifies the trend, and a moving average with a shorter period, or their crossing in the direction of the trend, then determines the entries. Traders, in this case, receive fewer signals to enter the market, but they tend to be more reliable.
The most popular combination of two moving averages is the combination of the MA50 and the MA200. When the MA50 crosses above the MA200, it is a signal to enter a long position (in this combination of moving averages, this cross is called a golden cross); on the other hand, when the MA50 crosses the MA200 to the downside (a signal known as a death cross) and goes below it, it is a signal to enter a short position. The picture below shows both situations where a golden cross appeared in the market first, followed by a death cross a few weeks later.

Moving averages are one of the simplest technical indicators. Of course, it is not a perfect tool (none of them are), but when used sparingly and sensibly, it can be an excellent tool for technical traders.
This article is for informational purposes only, and some information may not reflect the current service offering or product features. Please always verify the latest terms on the official product pages.
About FTMO
FTMO has developed a two-step evaluation process to find trading talents. Upon successful completion, you may be eligible for an FTMO Rewards Account with a balance of up to $200,000 in simulated funds. How does it work?


