


How to think in probabilities
Are you getting caught up by your emotions in trading? That is one of the reasons to start trading with a mechanical edge based on statistics! In this article, we will look at how you can start thinking and trading in probabilities!
How to think in probabilities
When uncertainty is involved in a game, it’s called a game of chance. We all know popular games such as Poker, Roulette, BlackJack etc.
Now, a game of chance is boring without any stakes, right? In a game of chance, people may put bets. A game which rewards or punishes based on chance is now a GAMBLE.
Gambling is fun. Gamblers enjoy a roller-coaster of emotions. Experiencing pain makes the gambler FEAR the outcome of loss. Winning makes them GREEDY for the dopamine rush. Adrenaline is their catalyst for excitement. He will be committed to injure himself to get even the slightest drop of happiness. What a great drug. Gambling is not only fun, but also dangerous.
What is the deal with trading now? You see, trading involves uncertain outcomes, and it involves bets. Shouldn’t we classify trading as gambling? I do not disagree with this statement. Trading will undoubtedly incite the same emotions as if you went into a casino and there will be people who will purely trade for the excitement.
However, some people decide to consistently make money in these games. The only difference? These people possess a statistical edge and follow strict risk management. These people evolve from gamblers to traders.
Statistical Edge
A statistical edge is the player’s advantage in a game of chance. If you have an edge, you will always come out on top in the long run.
Take a rigged coin for example. It will drop 51 % of the time in your favour (heads) and 49% of the time in your opponent’s favour (tails). Every time you win, your opponent pays you $1. Every time you lose, you pay your opponent $1.
The rules of this game are set. A game of chance should always give you these parameters: a probability of winning, a probability of losing, payout for winning, punishment for losing.
The probability of winning is 51%, hence the probability of losing is 49% (100% – 51%). Payout for winning is $1 and punishment for losing is $1 as well.
With these parameters, we will calculate the expectancy, which will determine whether you do possess a statistical edge, or not.
We toss the coin 100 times. In theory, heads will drop 51 times and tails will drop 49 times. In other words, we win $51 and lose $49, hence making a $2 profit ($51- $49). We tossed the coin 100 times; therefore we were risking $100 overall. As a result, we made $2. To calculate the expectancy, you simply take your profit/loss and divide it by the amount you risked through the whole game. For this example, we take $2 divided by $100 and we get $.02.
0.02 is our expectancy and what it means is that for every $1 we risk, we should make $0.02.
IF THE EXPECTANCY IS GREATER THAN 0, YOU POSSESS A STATISTICAL EDGE AND YOU SHOULD MAKE MONEY IN THE LONG TERM.
0.02 is greater than 0, hence the player who wins the coin game 51% of the time will make money in the long run.
A trading system basically has the same parameters. We will simply call the probability of winning a win rate. Then we have the average Reward to Risk Ratio (RRR). This is calculated by taking the average profit divided by the average loss of your trades.
Let us assume a system that wins 40% of the time and has a RRR of 2. A RRR of 2 means that when you win, you win twice as much as when you lose. We risk 1R on every trade (R is a fixed amount of risk). When we win, we make 2R. Out of 100 trades, we should theoretically win 40 trades and lose 60 trades. So what is our expectancy? We win 40 trades with a reward of 2R, hence we make 80R. We lose 60 trades, incurring a loss of 60R. At the end of 100 trades, we make 80R and lose 60R, thus being 20R in profit. Over 100 trades we risked 100R but made 20R in profit. Expectancy again is the amount gained divided by the amount risked. Therefore, 20R/ 100R = 0.2, so for every $1 we risk on a trade you earn $0.2 on average. The expectancy is greater than 0, so this strategy will make you money.
Risk Management
A winning strategy is not enough if you do not follow strict risk management. I like to tell myself that a trading strategy is just a tool, but what makes you money is your risk management. If you bet a little you win a little, if you bet a lot, you win a lot, but if you bet too much, you crash. You might have a good hand in Poker, but if you go all in, you risk losing the game.
TRADING IS A SURVIVAL GAME. THOSE WHO PROTECT THEIR CAPITAL STAY IN THE GAME TO PLAY ANOTHER DAY.
There are several ways to manage risk:
MARTINGALE
FIXED ABSOLUTE RISK
FIXED POSITION SIZE
FIXED RELATIVE CAPITAL RISK
In later articles, we will discuss each of these money management strategies. I personally like using FIXED RELATIVE CAPITAL RISK MANAGEMENT. The only reason is that for me it provides stable parameters for advanced risk management techniques, but I do not discriminate against these other strategies.
Trading with a Statistical Edge

While many traders back-test and document their trades to check the viability of the trading system, there is a tremendous benefit in tracking and using the data to optimize both your stop loss and profit target. When documenting trades, two of the most important pieces of data that I record is the drawdown and the profit potential.
To be clear, the drawdown is how far a trade goes against my position before going in my favour.
Whereas the profit potential is the maximum distance the trade moves in my favour, from my entry. It is not necessary and in fact is rarely, where I exit the trade. But certainly, getting out at the extreme of the move, or as close to it as possible, is the goal.
I document my trades two ways first, I use screenshots of the charts themselves where I annotate my entry, the time, the trade type and any other relevant information pertaining to my methodology such as strength and weakness analysis, multiple time frame analysis as well as correlation. I also record the drawdown and the profit potential of the trade on the chart.
I then enter the key data into my excel spreadsheet.
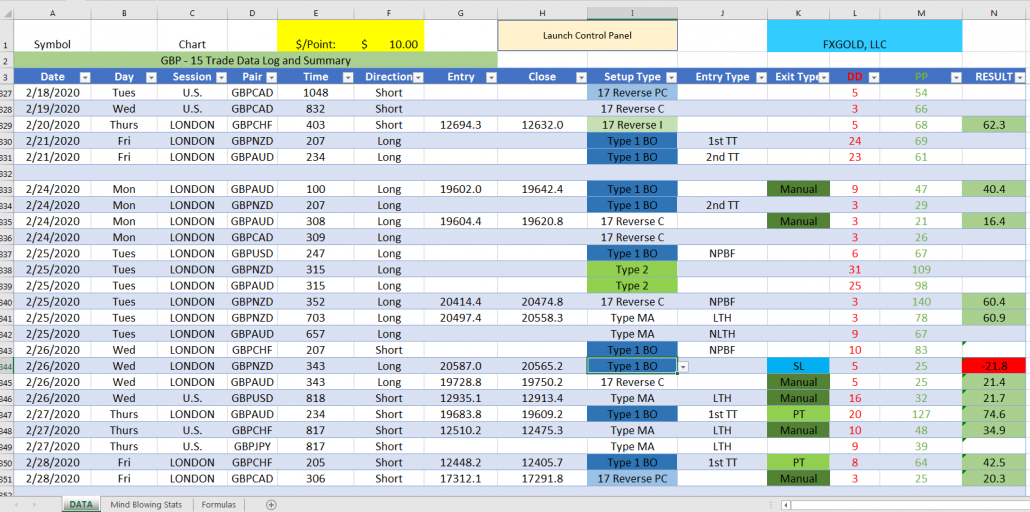
This includes the date, day, session, pair, time, direction, entry price, close price, set-up type, entry type, exit type, drawdown, profit potential and result. I then let excel do all the heavy lifting for me as I can then sort my trades multiple ways, by day, by session, by pair, by direction, by set-up type etc.
But where the cool stuff is under the tab “Mind-blowing stats” where I have statistics filterable by any of the above which will allow me to optimize both my stop loss and my profit target.
The application is discussed below.
If you use an account risk % to determine your position size (as you should), then the smaller the stop, the larger a position size you can trade. However, the stop must have a high probability of holding. The most trading books, manual, video’s etc., advise that your stop should be several pips beyond a recent swing high/low.
However, my trade documentation has allowed me to come up with a statistical edge for my stop placement.
As it can be seen in attachment “Drawdown”, trading my Type 1 BO (breakout out) on GBPAUD, 79.55% of the time my drawdown has been less than 25 pips, whereas it is only 81.82% at 30 pips and 84.09% at 35 pips.

So, while using a larger stop may prevent an extra loss or 2, the benefit of having a larger position size and therefore netting more money makes the extra loss(es) inconsequential.
Similarly, the profit target can be optimized as well.
Looking at the attachment “Profit Potential” and again staying with my Type 1 BO trades on GBPAUD, we can easily see that almost 80% of the time, these trades get between 20 and 30 pips.

This is a great place to take 1/2 of the position off and move the stop to flat. We can then let the remaining half run to about 50 pips where 59.09% of the trades reach.
Obviously, market conditions are not always the same but if you can identify when they are, i.e. correlated move or certain groups (commodity pairs or safe haven pairs) strengthening or weakening, then you can make an informed decision on how far a trade may run.
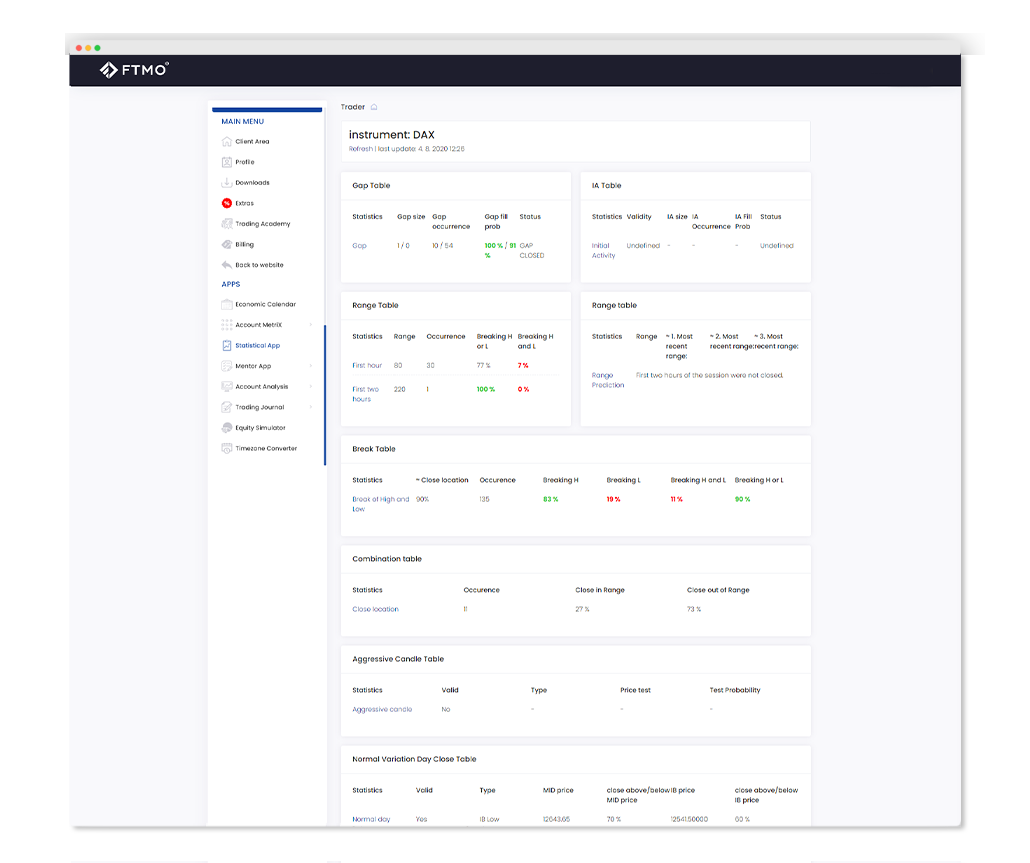
Initial activity occurs when the market opens outside of the previous day´s range. The goal of this analysis is to define the probability of the gap between the currently open and the previous high/low being closed.


- As many Free Trials as you need
- Up to $200,000 account
- No time limit

Worldwide Reviews