


How the candles form on the chart from AMD's perspective
Last time, we showed how to identify the three key phases of the market cycle — accumulation, manipulation, and distribution - and why understanding them is essential for every trader. Today, we'll explore how these phases shape individual candles on the chart and how the AMD approach can help refine trade entry timing.
Each candle has its own story
A candle on a chart is not just a simple visualization of the opening and closing price - it is an imprint of price action that often reflects the entire market story.
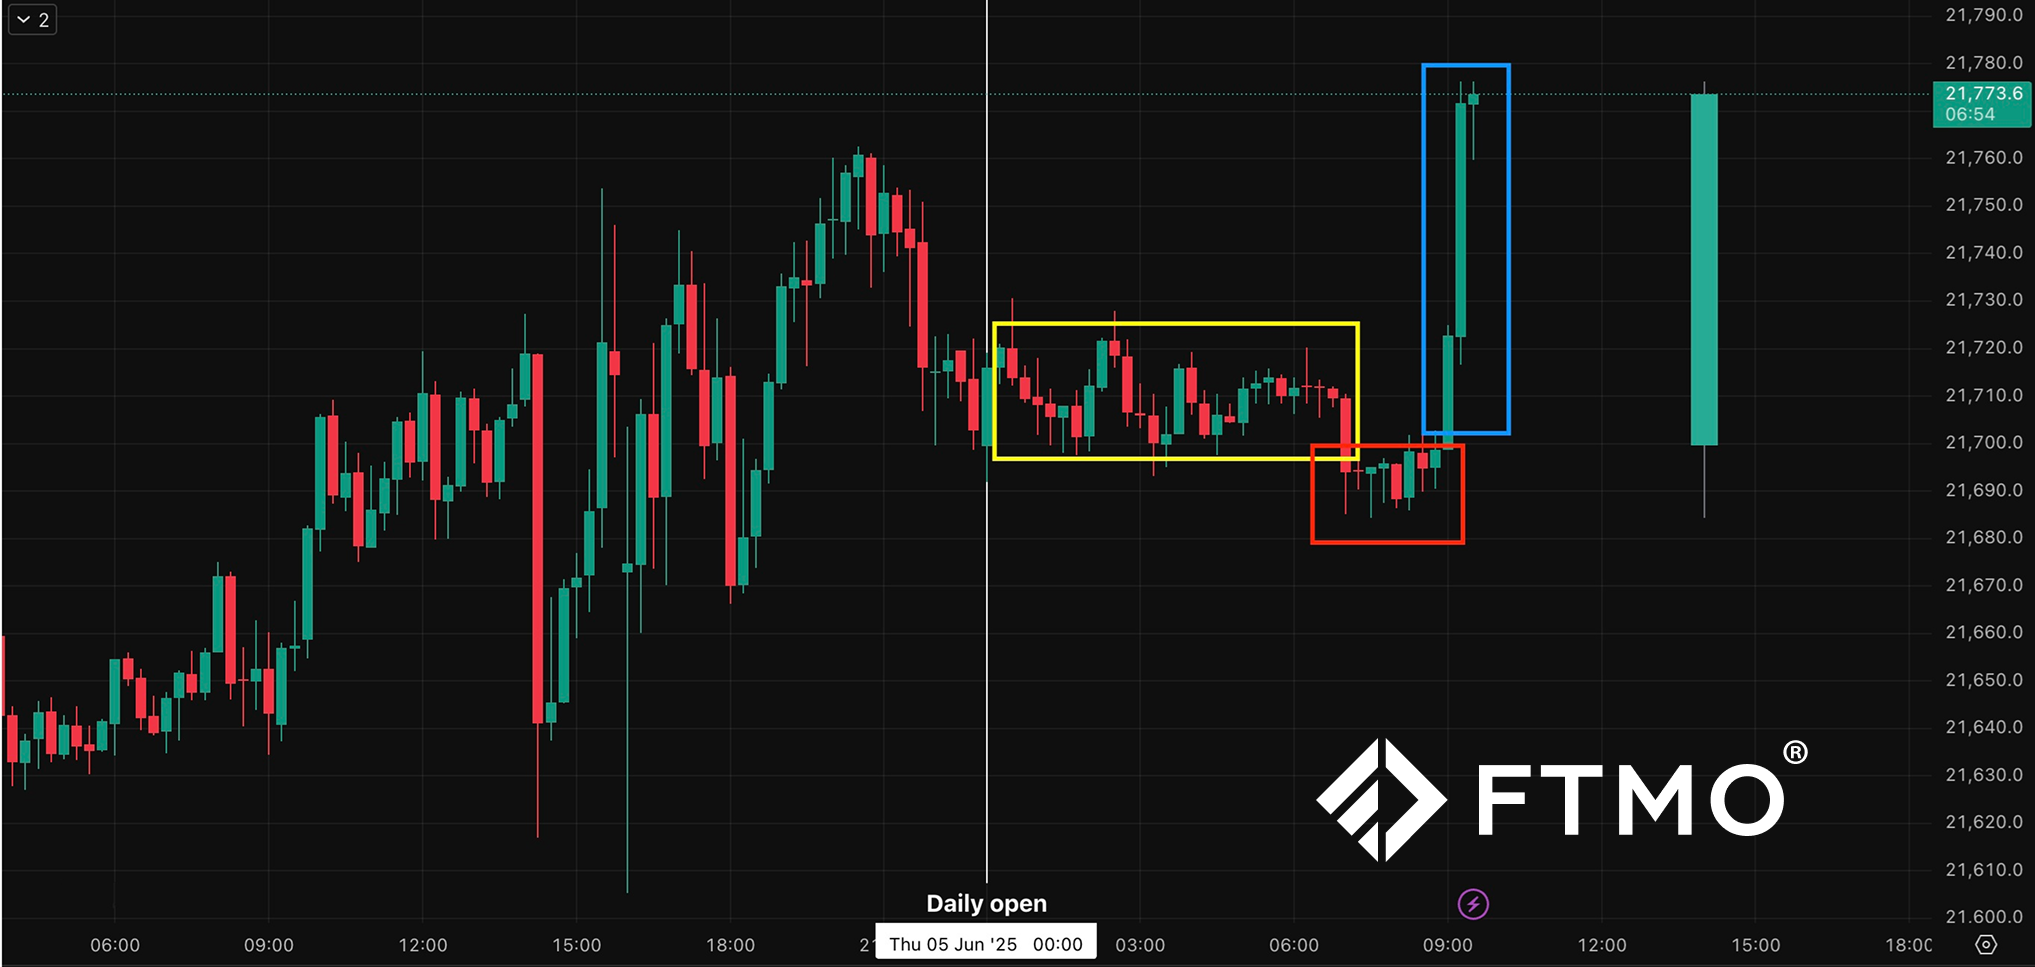
For example, a single daily (D1) candle may contain a whole sequence of events on a lower timeframe (e.g. M15) that correspond to the different AMD phases:
- • Accumulation → movement within a narrow band (consolidation), often near the candle’s opening price.
- • Manipulation → a sharp move in the opposite direction (wick formation) to trigger Stop Losses.
- • Distribution → a major price movement in favor of the big players, forming the body of the candle.
Each candle, therefore, conceals a structure of market behavior that can be better identified on lower timeframes. This enables a more comprehensive understanding of the market - not only by analyzing the shape of the candle but also by recognizing the intention behind its formation.

Top-down approach and more accurate entries
When using top-down analysis, the trader first observes the market structure on higher timeframes (e.g., W1 or D1) to get the overall context. They then move to lower timeframes (e.g., H1, M15) to look for specific price reactions and signals within each AMD phase.
For example:
- • D1 shows a strong bullish candle
- • On M15 within that day, a clear accumulation phase is followed by a false move downward (manipulation), and then a breakout upward as the distribution phase.
- • This allows for more precise entry timing and a better reward-to-risk ratio (RRR).
This approach to trading helps align your view of market developments across multiple levels - enabling you to benefit from the broader context while smartly timing entries where they make the most sense.
The most common mistakes when reading candlesticks from an AMD perspective
Novice traders often make the mistake of trying to identify accumulation, manipulation, and distribution in every candle or price movement - regardless of market context. It's important to remember that AMD phases do not occur mechanically; they emerge as a result of market psychology and the intentions of larger players.

If the market is not in an environment suitable for liquidity creation (e.g. no prior consolidation or low volume), the recognition of these phases can be misleading.
Another common mistake is entering too early - either during the accumulation phase or in the middle of manipulation. Instead, it’s often better to wait for confirmation of the distribution phase - for example, through a change in market structure, a price move back into the range, or a reaction to an order block.
How to check this on a chart (practical tip)
Want to see how the AMD phases relate to candles on a higher timeframe? Open the EUR/USD pair on the M15 and D1 timeframes. Select one significant daily candle and analyze its internal structure on the M15 chart:
- • Where did the consolidation (accumulation) occur?
- • Where did the false move in one direction (manipulation) take place?
- • And where did the main movement (distribution) follow?
This type of analysis helps train your eye and gradually allows you to recognize patterns without relying on indicators. The more consistently you practice it, the more you'll begin to read the market holistically - not just as a series of candles, but as the result of decisions made by players with different intentions and time horizons.
Conclusion
The AMD approach isn’t about predicting the market — it's about reading what is actually happening. Once you begin to see that each candle has its own internal rhythm, often aligning with specific market phases, a new perspective on price action opens up.
By linking higher and lower timeframes, you gain an early advantage — and in trading, the one with the head start has the edge.
Final Tip: Try marking the AMD phases on the M15 chart for any instrument, and then compare their impact on the D1 candles. Observe the structure, spot recurring patterns, and think like smart money. Trade safely!

This article is for informational purposes only, and some information may not reflect the current service offering or product features. Please always verify the latest terms on the official product pages.
About FTMO
FTMO has developed a two-step evaluation process to find trading talents. Upon successful completion, you may be eligible for an FTMO Rewards Account with a balance of up to $200,000 in simulated funds. How does it work?