


What’s Next for Gold? Technical and Fundamental Outlook
Gold is going through one of the strongest bullish phases in recent history. Since the start of the year, its price has risen by more than 50%, reaching a new all-time high of around $4,382 per troy ounce.
This remarkable rise has captured the attention of traders and investors worldwide. It reflects not only the market’s momentum but also broader shifts in the global economy, monetary policy, and confidence in fiat currencies. Let’s explore the key factors behind this rally, how fundamentals have influenced the market, and what the charts suggest for the months ahead.

Why Gold Keeps Rising: The Core Fundamentals
1. Federal Reserve Interest Rate Policy
On 30 October, the US Federal Reserve announced its second rate cut of the year, lowering the rate from 4.25% to 4%. This move marked a clear shift towards a more accommodative stance. Lower interest rates reduce real yields, which increases gold’s appeal as a non-yielding asset. Historically, similar cycles have pushed gold higher as investors sought protection from a weakening dollar.
2. Trade Tensions Between the US and China
Trade tensions between Washington and Beijing have intensified once again. New tariffs on Chinese products and China’s countermeasures have raised concerns about global growth. When markets become uncertain, investors typically move capital into safe-haven assets. Gold serves not only as a store of value but also as a reflection of confidence in the stability of the world economy.
3. A Weaker US Dollar
The US Dollar Index has fallen to its lowest level since 2022. A weaker dollar makes gold more affordable for foreign buyers and increases overall demand. This effect becomes stronger when combined with lower interest rates, creating favourable conditions for continued strength in the gold market.
4. Central Bank Gold Accumulation
Central banks continue to add gold to their reserves at a record pace. In the first half of 2025, they increased their holdings by over 400 tonnes, with China, India, and Turkey leading the way. This shift towards diversification away from the dollar supports gold’s position as a strategic reserve asset and adds long-term stability to the market.
Is Gold’s Rally Losing Momentum?
After a series of strong fundamental catalysts, gold hit its all-time high in October before suffering its sharpest single-day drop in four years. For many traders it was unexpected, but from a technical perspective it was a healthy correction following a steep rally.
The question now is whether this is a pause or the start of a deeper shift. Over the following sessions, gold continued to weaken, closing below a key support zone. The market structure turned from bullish to short-term bearish, showing early signs of exhaustion among buyers.

Technical Outlook
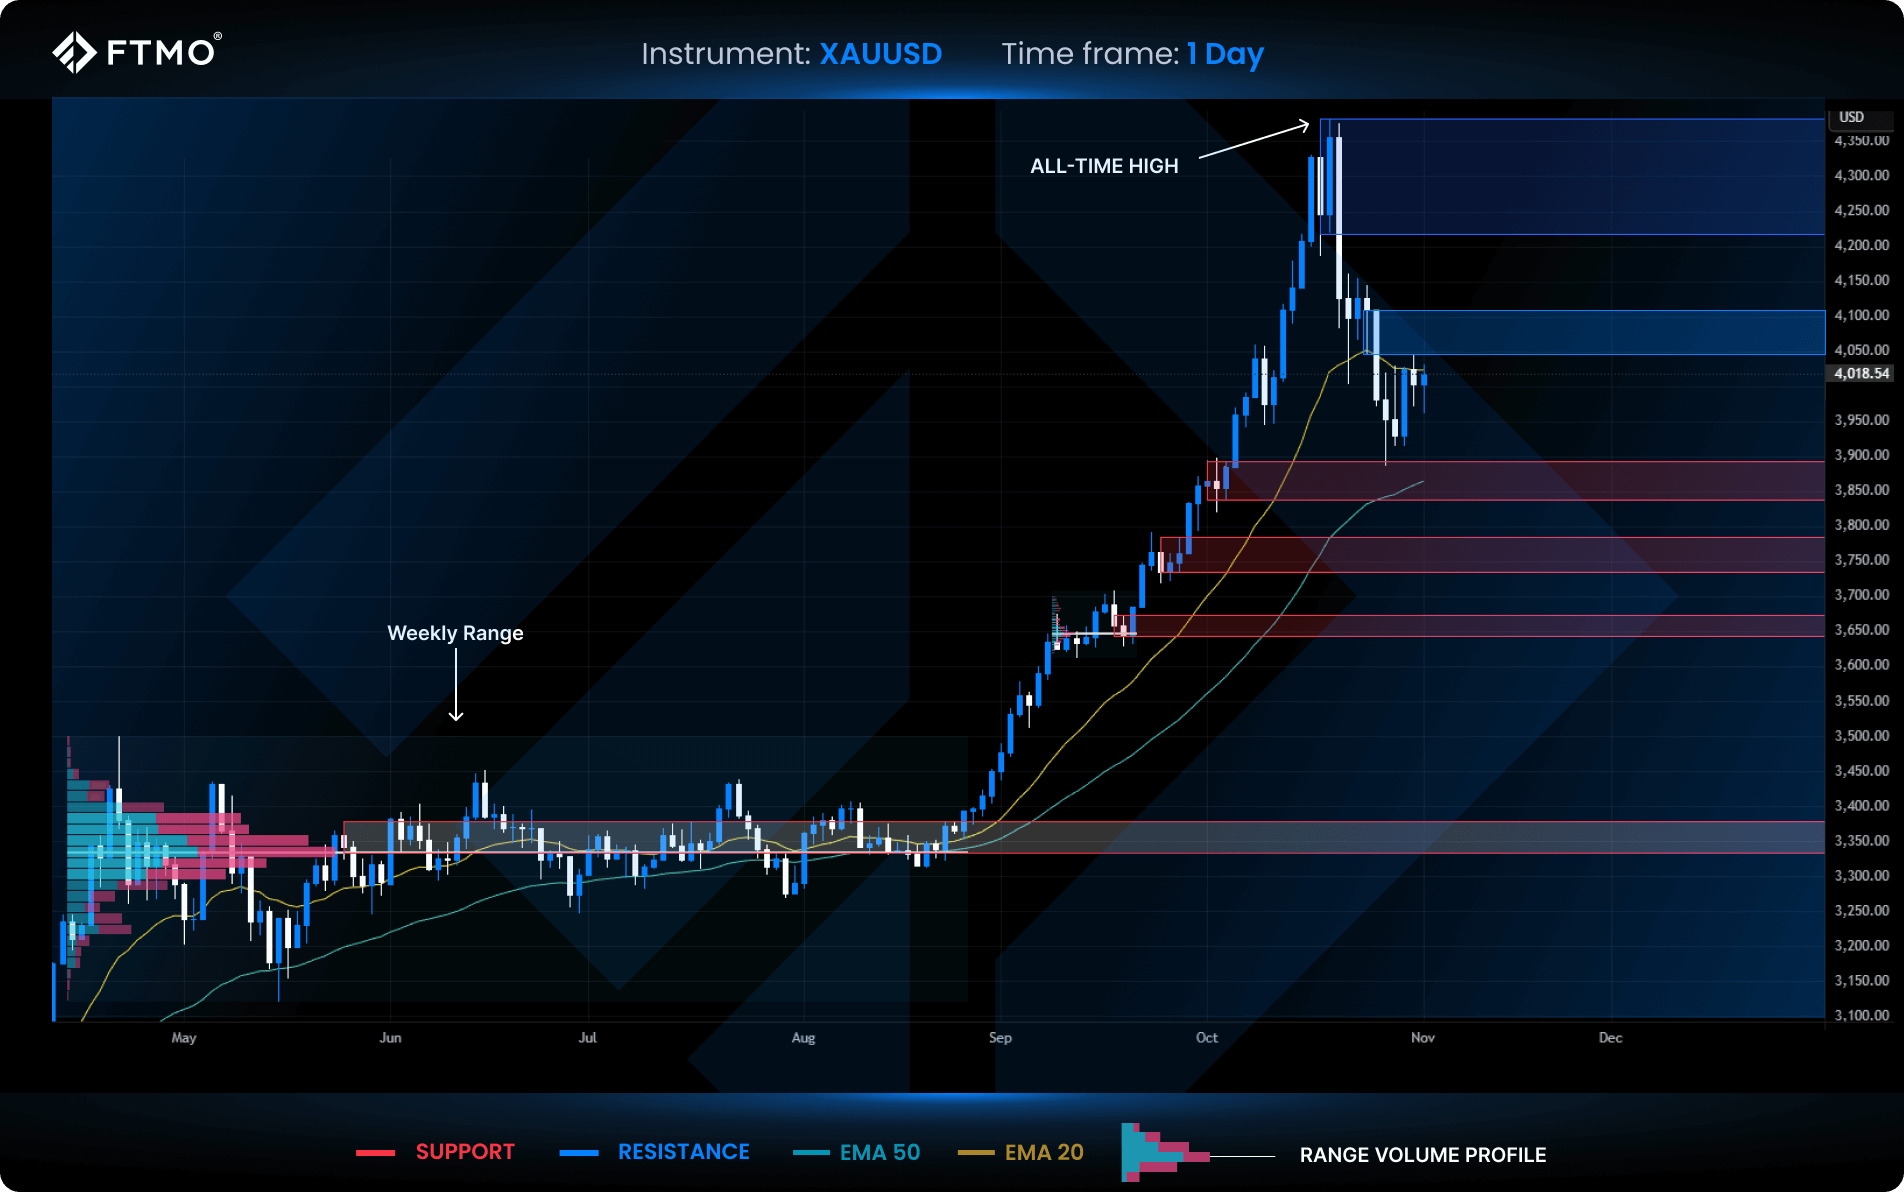
To evaluate the current trend, we applied a combination of Fair Value Gap (FVG), Exponential Moving Averages (EMA 20 & EMA 50), and the Ranged Volume Profile. Together, these indicators reveal both momentum and market balance between volume and price.
• Fair Value Gap (FVG)
FVG highlights unfilled price areas that often act as magnets for price action. These zones serve as important regions where gold could revisit or react, functioning as potential supports or resistances.
• Exponential Moving Averages (EMA 20 & EMA 50)
EMA 20 reflects short-term sentiment, while EMA 50 represents the medium-term trend. When EMA 20 is above the price, it indicates short-term bullish momentum; when below, it signals bearish pressure. EMA 50 defines long-term bias.
• Ranged Volume Profile
This indicator shows where trading volume is most concentrated, revealing areas of strong market interest. This typically corresponds to critical support or resistance zones, helping traders anticipate where the next reaction might occur.
Key Support and Resistance Levels to Watch
Resistance Zones
• $4,217 – $4,382: The all-time high zone where the FVG formed. A confirmed breakout here could renew bullish momentum.
• $4,045 – $4,108: A local resistance created by previous strong selling. A sustained close above this level could indicate a shift in sentiment towards buying pressure.
Support Zones
• $3,891 – $3,838: The first significant support identified by price action. A bullish pin bar formed here in the past, suggesting strong buying interest.
• $3,783 – $3,733: A secondary support zone defined by FVG.
• $3,675 – $3,641: Support derived from the volume profile, marking a zone where buyers previously stepped in.
• $3,378 – $3,333: A long-term base from summer where the rally began. It appears on the weekly timeframe and carries higher importance.
What Could Happen Next
• Bearish Scenario: If gold remains below EMA 20 and fails to close above the local FVG resistance zone, the correction could continue towards lower support levels. A break below $3,733 may open the way for a deeper retracement.
• Bullish Scenario: If gold breaks above $4,045 – $4,108 and holds above EMA 20, the structure could shift back to bullish, paving the way for a retest of the all-time high area.
Final Thoughts: Consolidation or the Start of a New Leg Higher?
Gold’s exceptional rally has entered a cooling phase, but its long-term outlook remains supported by strong fundamentals. The Fed’s rate cut to 4%, a weaker dollar, and continued central-bank demand provide a strong foundation for the metal’s value.
Technically, the market currently leans bearish in the short term. The next few sessions will show whether buyers can defend the key support area. If this level holds, gold may soon find strength for another upward move. If it breaks lower, a deeper correction is likely before any renewed rally.

About FTMO
FTMO developed a 2-step Evaluation Process to find trading talents. Upon successful completion you can get an FTMO Account with a balance of up to $200,000. How does it work?.