


FX Blue App Suite – Try the improved charts in MT
Starting in May 2025, FTMO is offering an exclusive suite of tools from FX Blue. This expands the trading capabilities for all FTMO clients who prefer the MetaTrader 4 and MetaTrader 5 platforms. One extension that’s sure to appeal to active traders is the enhanced chart window itself.
The App Suite is a comprehensive package of over 35 advanced trading tools, developed by FX Blue in partnership with FTMO. These tools are specifically tailored to meet the needs of FTMO Traders and clients and are available to anyone with any FTMO account—including Free Trial accounts (a Windows operating system is required). The FX Blue App Suite includes a wide range of powerful and user-friendly features, from sophisticated charting and risk management calculators to real-time sentiment analysis and advanced trade execution functions.

New Chart Window
In addition to a completely new perspective, the new Chart tool also offers improved risk management before entering a trade, along with a range of additional features that complement those available in the standard MetaTrader environment.
When opening the application for the first time, you’re presented with a relatively simple view of a classic candlestick chart. All the functions that allow you to customize your trading experience are located in the top panel, which we’ll now explore one by one. Although the layout appears clean and minimal at first glance, the top panel is packed with features, offering plenty of configuration options for every type of trader.
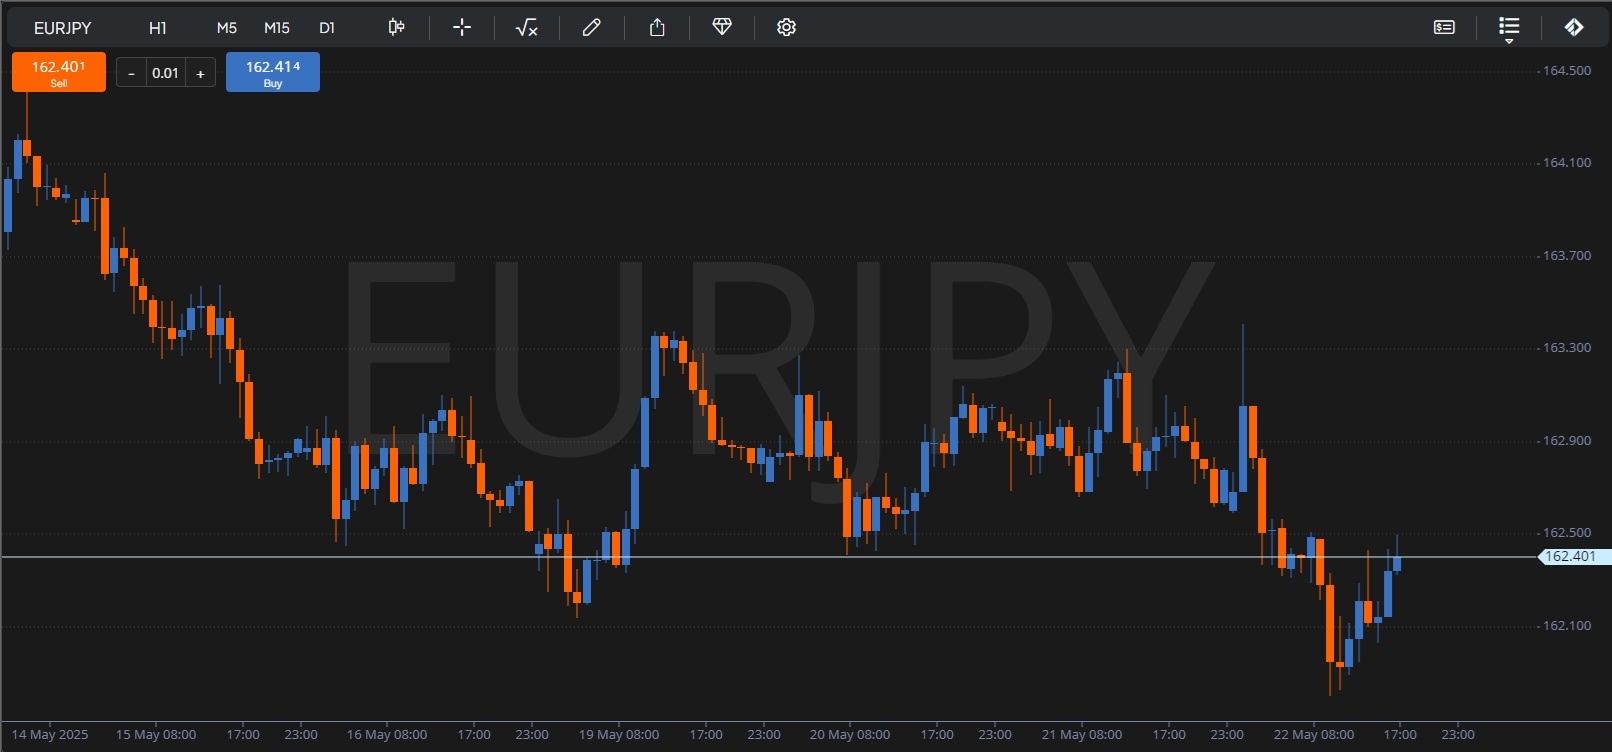
Start by selecting the instrument in the top-left corner. Clicking on the name of the currently displayed instrument opens a menu of available options. You can either choose one of your favourite instruments, select from your open positions, or browse through several other categories, all of which can be customized to your preferences. For example, in the Market List, you can choose from all available instrument types and mark your favourites for easy access.
Seconds timeframe? You want it!
Next in the menu are the timeframes. In the new window, four timeframes are displayed: the current one on the left and three others that can be quickly selected. You can also use the timeframes directly from the MetaTrader window (note: unfortunately, the other buttons on the MetaTrader panel do not work with this tool). By clicking on the current timeframe, you can access a menu where you can select your favourite timeframes to be shown in the panel. This includes a wide range of minute and hourly options, as well as the classic daily, weekly, and monthly timeframes — and even second-based timeframes and tick charts. Anyone who hasn’t tried a five-second chart can’t truly call themselves a scalper!
Choose your chart type and time zone
If you thought you knew all the different types of price chart views, FX Blue will try to prove you wrong. In addition to the classic (and hollow) candlesticks, bars (OHLC, HLC), and four types of line charts (including one that shows the high and low), you’ll also find charts such as Heiken Ashi, Renko, Range, High/Low, Kagi, Point & Figure, Column, Averaging, and Line Break. There’s even an inverse chart and the option to overlay an additional instrument chart, either directly within your main chart or in a separate window. You can also set the time zone so that candles reflect your chosen time setting.

In another menu, you can configure the appearance and functionality of the mouse cursor. It can be shown as a classic arrow, a crosshair, or a marker. You can also enable it to drag the chart when clicked (although this is also possible by holding the Shift key), use it as a measuring tool, or place orders with a single click (Order mode).
Indicators and Objects that trade for you
In the Indicators menu, you’ll find countless options grouped by category—bands, price, volume, volatility, trends, momentum, and more. You can mark your most frequently used indicators as favorites and customize their settings. In the Advanced section, you can also add your own custom indicators.
Next is the Drawings menu, where you can select from various shapes and patterns, tailored to different analysis styles—trendlines, ranges, geometric shapes, Fibonacci tools, candle countdowns, and more. These can all be drawn on your chart. An especially interesting feature is the ability to assign actions to objects (e.g., opening or closing a trade when the price touches a trendline). Once again, there are no limitations.
Share your ideas
If you want to showcase your chart setup, share an analysis, or present an interesting idea you've marked directly on your chart, you can do so using the Share menu.
In the Settings menu, you can adjust the chart to fit your preferences—both in terms of appearance (Settings) and the templates or add-ons that appear on the chart. Under the Show section, you can enable features such as an Order Ladder for quick trade entries, a Scrollbar for fast navigation, and custom shapes for position markers, which also allow direct editing of open trades. You can even set an option to skip confirmation for every change or adjustment to an open position—something that’s enabled by default.
Manage Risk Quickly and Easily
On the right side of the top panel, there are three functions that will be appreciated by all traders who miss the ability to quickly set up a trading position directly on the chart, as is not possible in the standard MetaTrader interface.
Furthest to the right, under the FTMO logo, is the so-called Deal Ticket. As the name suggests, this is a tool for placing orders. You can choose between a simplified or full setup (as shown in the image), where you can configure the order type (Market, Limit, Stop, Stop Limit), volume (in lots, units, as a percentage of equity or balance, or based on the amount you want to risk), and SL and TP levels (based on various parameters, including the high or low of the last candle).
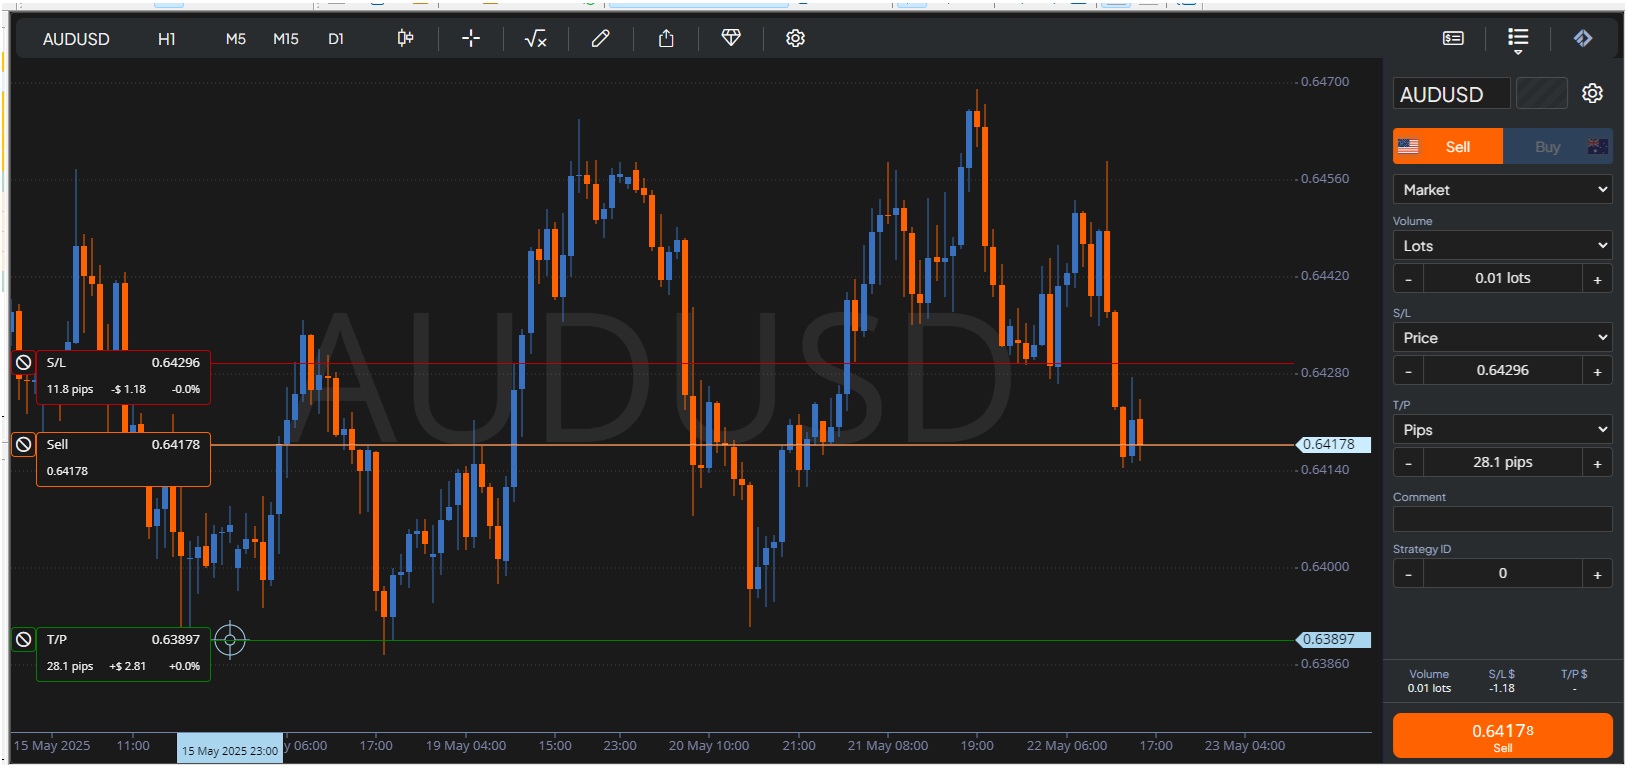
At the same time, markers will appear on the chart, including SL and TP levels, which you can set directly by dragging them to the desired positions. Once placed on the chart, all you need to do is set the correct volume (according to your risk management rules), and you will immediately see how many pips, dollars, and percentage points your SL and TP represent. It’s quick, easy, and eliminates the need for a calculator.
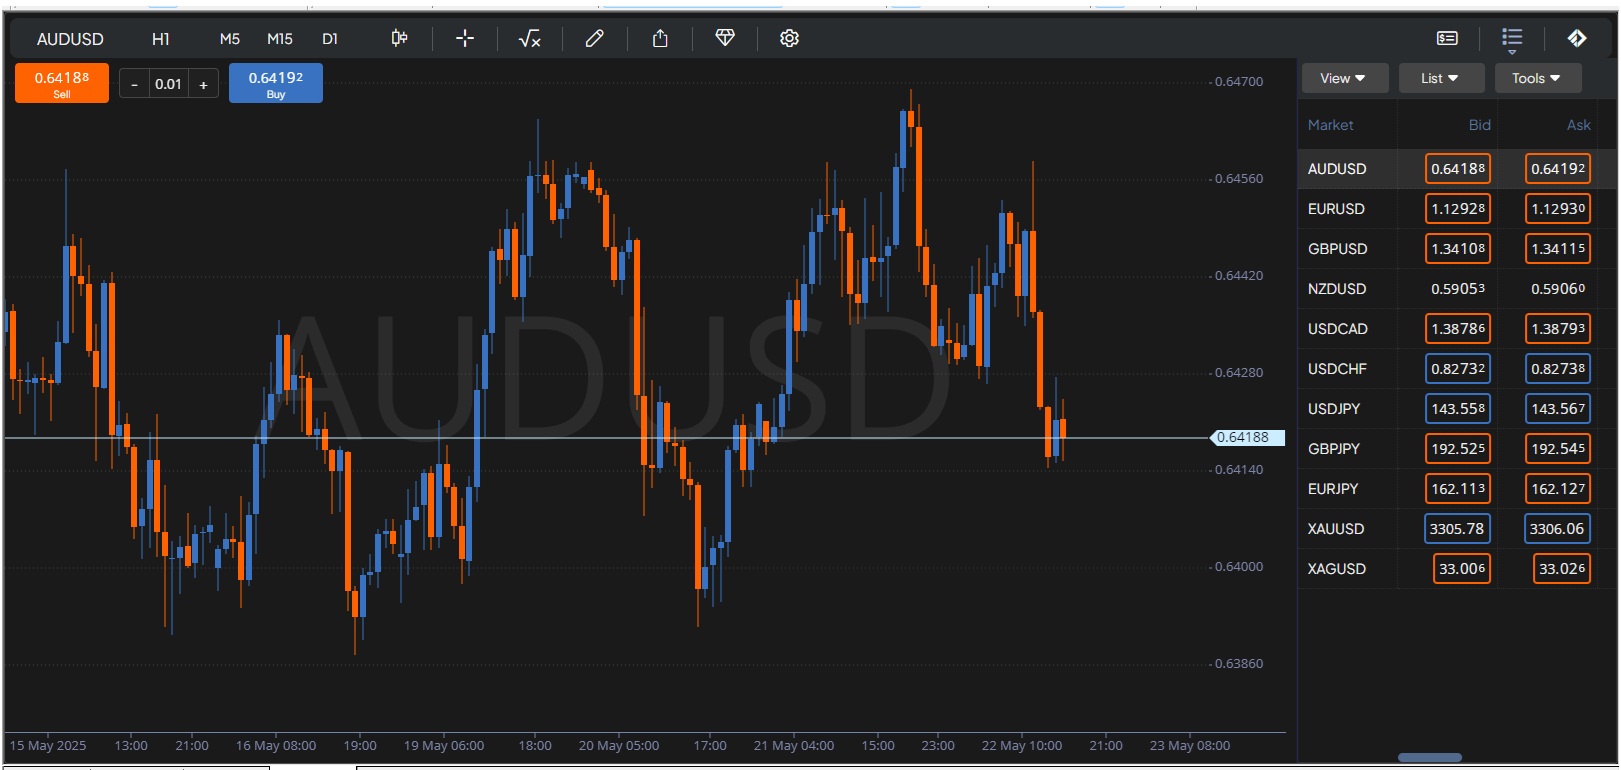
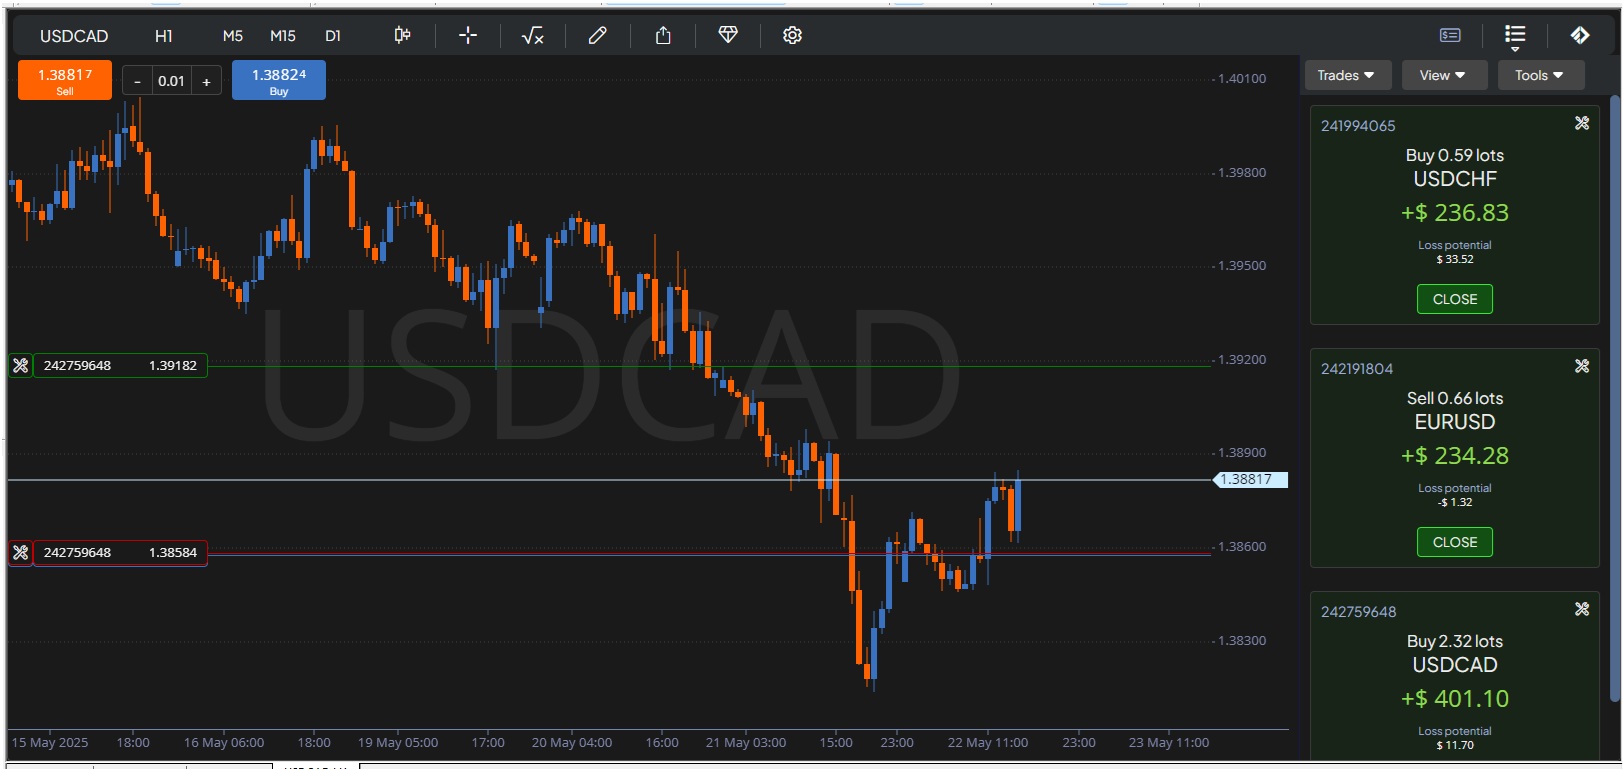
Next to the Deal Ticket is the instrument list, which—like everything else—can be customized to your preferences. It can be displayed as a simple list or as a grid, as shown in the image, where you can specify what and how information is displayed (such as prices and their changes, spreads, instruments by asset class, profit/loss, etc.). You can even place quick orders directly from this list (though without SL and TP). Smaller deal tickets can also be displayed.
Last on the menu is the Open Trades section, which you can use to manage positions individually or in bulk. You can edit SL and TP for individual trades or all of them, close full or partial positions (including selecting only profitable or losing trades), or open one or all positions in the opposite direction.
Conclusion
The App Suite by FX Blue is indeed a powerful and highly useful tool that will be appreciated by all traders who are accustomed to the MetaTrader environment but sometimes miss certain features—features they would otherwise have to download from the internet or program themselves. We believe you will take full advantage of its potential and that it will help you achieve even better results than before. Trade safely!

About FTMO
FTMO developed a 2-step Evaluation Process to find trading talents. Upon successful completion you can get an FTMO Account with a balance of up to $200,000. How does it work?.