Multi time frame analysis - an approach suitable for every trader
When technical forex traders enter the market, many of them remain focused just on the one time frame that suits their style. What they don't realize is that this approach may cause them to lose track of important support and resistance levels or long-term trends. Simultaneously monitoring multiple time frames is an easy way to get a much better overview of what is happening in the market.
Forex gives everyone the ability to choose the strategy and approach that suits them. It doesn't matter if the trader focuses on scalping, intraday trading, swing trading or takes a longer-term positional approach. Depending on his style, the trader chooses the time frame which he uses to follow the price movement and to decide when to enter the market.
Intraday traders naturally follow short-term time frames and definitely will not use four-hour charts to determine their market entries. On the other hand, long-term position traders tend to follow long-term trends on daily or weekly charts and shorter time frames are not that important to him in the first place.
An approach suitable for everyone
However, this does not mean that an intraday trader cannot use the four-hour chart, just as a position trader can use the 15-minute chart. In any strategy, observing multiple time frames can be beneficial to everyone as it gives the trader a different perspective and view of the markets. A long-term trader on short-term charts can fine-tune his entries with greater precision while on the other hand, following longer-term trends can help intraday traders avoid some unnecessary entries that could end up in losses.
Since forex is the most liquid market in the world, even charts on the shortest time frames are still useful (they don't look like spilled tea). In addition, the forex market operates from Monday to Friday 24 hours a day and during different trading sessions, traders can use different strategies and different time frames depending on whether the markets tend to create trends (European and American sessions) or move more sideways within a certain range (Asian session).
Too much of a good thing
It is important to note that combining too many time frames can create confusion in the trader's decision-making. In fact, different time frames may also send conflicting signals. It is also impossible to determine exactly which time frame is the most suitable for which trader.
It is generally recommended to follow three time frames and use the 4:1 or 6:1 rule. This means that the middle timeframe should be four (or six ) times greater than the shortest one and at the same time four (or six) times shorter than the longest one.
If the trader's main time frame is one H1, he can use a four-hour or six-hour chart for a broader view of the markets. For more precise market entry, he will then use a 15-minute or 10-minute chart.
The medium-term timeframe gives the investor a picture of the short and medium-term market movements and should be the main period for entering SL and TP levels. The longest timeframe determines the trend and direction of the market and sheds more light on important support and resistance levels. It is still possible to open positions against this major trend, but their potential may be limited. The shortest time frame is then suitable for the ideal timing of market entries. Since it includes the most "noise", it is not the most suitable for determining the overall direction of the trade.
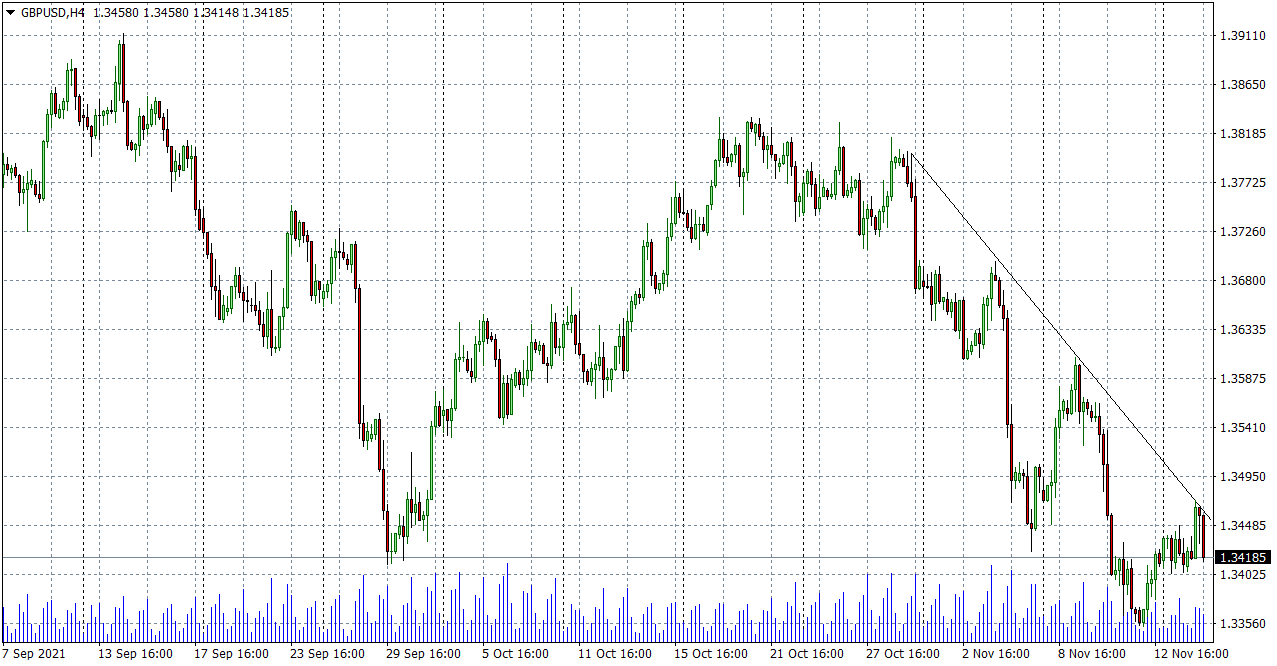
We can illustrate this with the example of the GBPUSD currency pair. On the 4 hour chart, we can see a fairly clear downtrend that has been going on since the end of October. The price broke above the September support level a week ago, came back above it, but after the bounce from the trend line, the price is once again headed downwards.

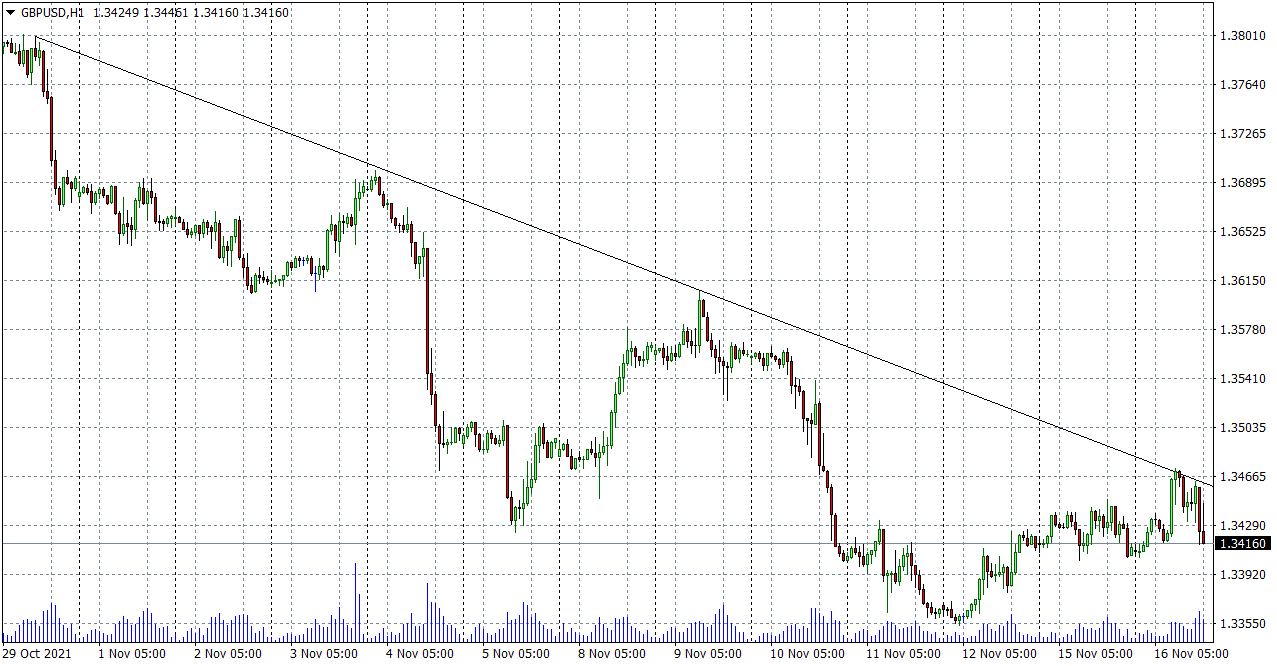
On the 1 hour chart, it could have looked like the beginning of an uptrend, but a look at the chart with a longer time frame shows the trader quite clearly that a long position might not be a good idea. In addition, the price has formed a lower high, which could indicate a trend reversal.

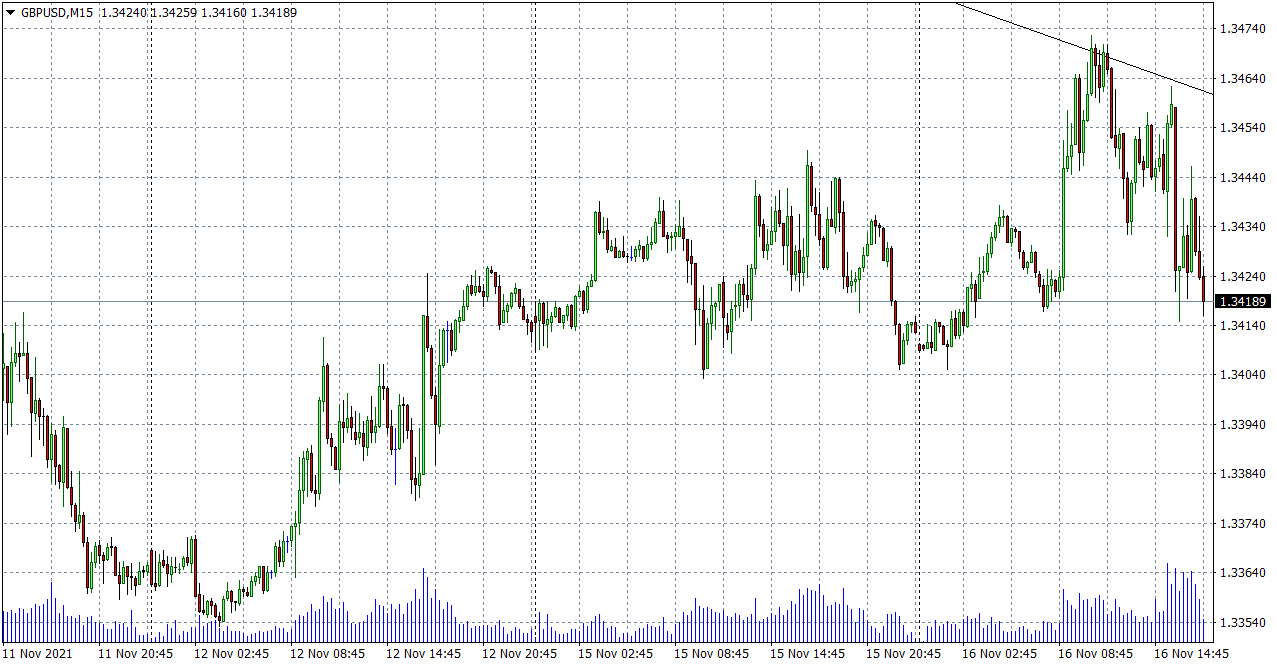
The 15-minute chart shows quite clearly that the price has failed to make a new high. If the price falls below the low from the previous day (which is also the round number 1.3400), it could be an interesting sell signal.

If the trader was only looking at the hourly chart, he might get the feeling that the market is in an uptrend and speculate on a rise in the pound against the dollar. A look at the longer time frame eventually showed a fairly strong downtrend and a break of the support level, on the shorter time frame the trader can then fine-tune the entry.
Watching multiple time frames should be used by all traders who want to have a clear view of what is going on in the market, and also want to optimize their entries into the market. Multi-time frame analysis is a very good tool that identifies longer-term trends while allowing you to enter more accurate entries on shorter time frames.
About FTMO
FTMO developed a 2-step Evaluation Process to find trading talents. Upon successful completion you can get an FTMO Account with a balance of up to $200,000. How does it work?.


