


Use the Initial Balance to your advantage
Initial Balance is a relatively simple tool that uses the volatility and trading volumes at the beginning of a trading session to determine the possible further development of the market during the trading day. How can you use it to your advantage?
The Initial Balance is used by traders to establish a reference price range at the start of the trading day, usually in the first hour of trading in a particular market. It can be used by equity and commodity traders, but can also find its use among forex traders.

Why the Initial Balance is important
The term Initial Balance was originally used in the Market Profile method to refer to the first hour of trading on a selected instrument. Today, this tool is also used by traders on its own without using the Market Profile, but the principle is the same. It is based on the fact that the volatility and trading volumes executed during the first trading hour after the market opens on a given investment instrument (when traders should not trade) can provide traders with a very good indication of how the price will evolve throughout the following trading session.
At the beginning of the trading session, particularly during the first hour, market activity is very strong and the volumes realised during this period (together with the last hour before the US markets close) make up a large part of the total trading day volumes. For large institutional traders, this is the period when they place their positions in the market, and thus the first hour after the market opens is of great importance to all traders in terms of future market action. For swing traders and longer-term investors, the initial balance may be the first two days of the week, or the first two weeks of the month.
How to determine the Initial Balance
Determining the Initial Balance is relatively easy, it is formed by the price maximum and minimum that is formed during the first trading hour. On an hourly chart this is the maximum and minimum of the hourly candle, on a fifteen minute chart it is the maximum and minimum that is formed on the four candles from the start of that trading session (as in the image below).

IB is easiest to determine for instruments that have fixed opening hours, such as stocks. For forex, CFDs or futures contracts that do not have opening hours, it may not be so clear-cut, but here too we can follow the normal opening hours of the various markets, or trading sessions such as the London, New York or Tokyo sessions, etc. Thus, for forex pairs, a trader can set the IB according to the zone in which he trades, so for the EURUSD pair it can be between 9:00 and 10:00 Central European Time (CET), or 8:30 to 9:30 Eastern Standard Time (EST) in the US.
Range width and volumes
The high and low of the first trading hour thus create a band that acts as a reference from which further market action develops. The width of this reference band, combined with the volume of trades executed during this period, can tell traders who is ruling the market and whether the price will move in a strong trend during the day or will move in a band and the movements will be lacklustre.
When the range is narrow and the volumes in the market are lacklustre, it can be a sign that there is little interest in trading at the levels and there is a greater chance of a stronger trend emerging during the day. On the other hand, when the range is wide and the volumes at the beginning of the trading day are high, it indicates a high interest in trading at the given levels and the possibility that the price will move within the range during the day.
At the same time, the limits of the Initial Balance range can serve as support and resistance levels and thus be good points for position entries or for determining Stop Loss and Take Profit levels. When the bandwidth and volume indicate the possibility of a trending market, crossing the upper border of the range can be a potential signal to enter a long position and, conversely, crossing the lower border can signal a potential short position. Of course, in the case of entry into a position, a confluence of multiple factors is ideal, or confirmation using price action or the aforementioned Market Profile.
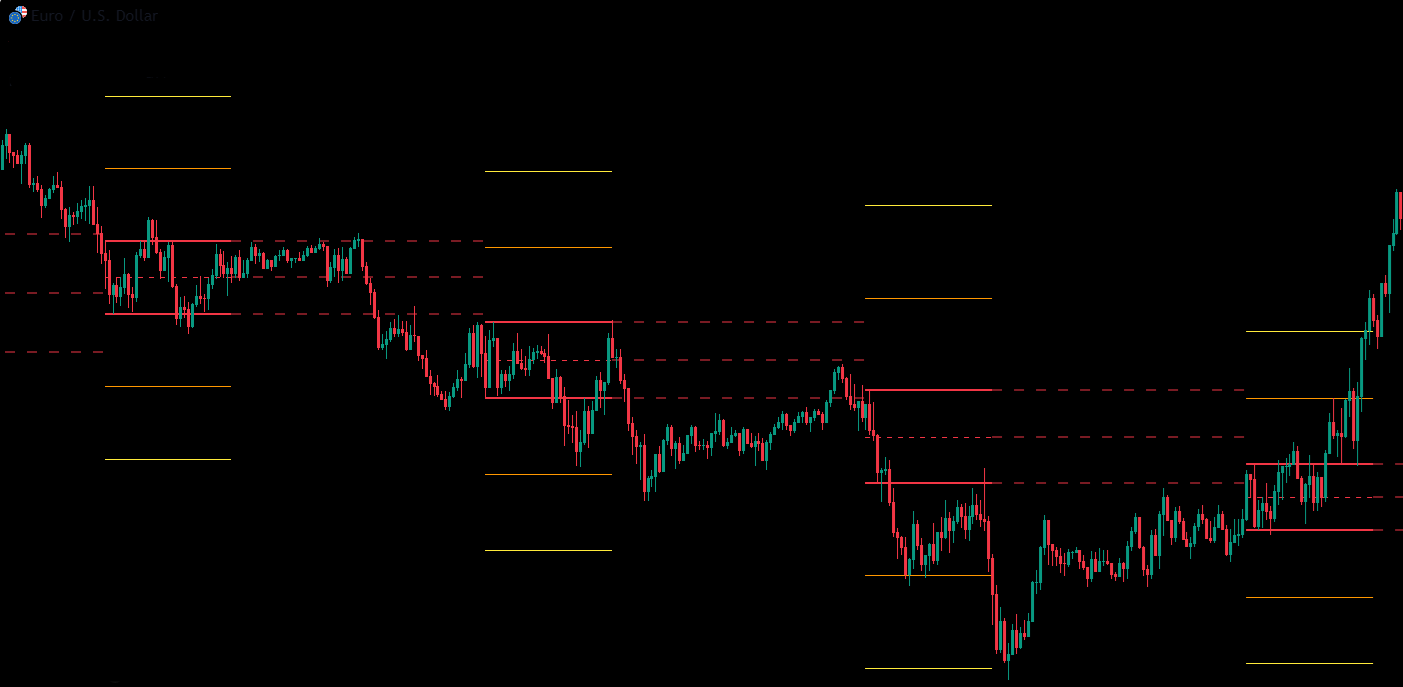
In the picture we have marked IB on the EURUSD pair as red lines and also orange and yellow lines as multiples of the width of the band itself indicating possible TP levels in case of a line crossing. As can be seen, the lines themselves often form strong support and resistance levels, but at the same time traders need to beware of false signals, which are often the reason why some traders are not successful when using this method.
Conclusion
Initial Balance is a simple tool that can assist a trader in determining reference price and sentiment in the markets, but as is the case with other similar tools and indicators, it is not recommended to use it as a standalone source of buy and sell signals. As mentioned above, it was originally part of the Market Profile method and even today most traders use it together with the Market Profile. It can of course be used on its own, but ideally it should be used as part of a tested strategy using other tools. Trade safely!


- As many Free Trials as you need
- Up to $200,000 account
- No time limit

Worldwide Reviews