


Trading Week Ahead: PMI and Jobs Numbers Incoming
Markets are bracing for three key US data releases that could shake up Fed expectations and trigger market volatility. Are you ready?
• US Flash PMI: A Quick Pulse Check of the Economy
Wednesday’s Flash PMI will offer an early read on April's economic activity. Analysts expect the Manufacturing PMI to fall from 50.2 to 49, hinting at a possible contraction. The Services PMI, more closely linked to consumer behaviour, is forecast to drop from 54.4 to 52.8. Since PMI data often moves markets, any surprise could spark sharp reactions in the dollar and equities.
• Weekly Jobless Claims: Labor Market Stability in Focus
Investors will watch Thursday’s jobless claims report for signs of change in the labour market. Last week's figure came in at 215,000, showing continued strength. A steady or lower number would support the Fed’s cautious stance. However, a sharp increase could revive expectations for earlier rate cuts.
• Home Sales: The Housing Market as an Economic Litmus Test
On Wednesday and Thursday, data on both new and existing home sales will be released. Since housing makes up a significant portion of consumer spending, figures from this sector often reflect household sentiment and their willingness to spend. Strong demand could indicate that the American consumer remains resilient, while weaker results may raise concerns about a potential economic slowdown.


| Date | Time | Instrument | Event |
|---|---|---|---|
| Wednesday, Apr. 23 |
9:30 AM
|
EUR
|
German Flash PMI |
|
10:00 AM
|
EUR
|
EuroArea Flash PMI | |
|
10:30 AM
|
GBP
|
Flash PMI | |
|
3:45 PM
|
USD
|
Flash PMI | |
|
4:00 PM
|
USD
|
New Home Sales | |
| Thursday, Apr. 24 |
2:30 PM
|
USD
|
Unemployment Claims |
|
4:00 PM
|
USD
|
Existing Home Sales | |
| Friday, Apr. 25 |
8:00 AM
|
GBP
|
Retail Sales |
|
2:30 PM
|
CAD
|
Retail Sales |
Technical Analysis with FVG Strategy
This trading method combines the EMA 20 and EMA 50 to assess market trends, along with the Fair Value Gap (FVG) to detect areas where price moved too quickly, leaving behind imbalances. These gaps often signal high-probability entry and exit points. The approach is effective on pairs like EURUSD, GBPJPY, US30, and XAUUSD, offering a review of recent price behaviour and highlighting ongoing trade opportunities.
Last Week’s Opportunities
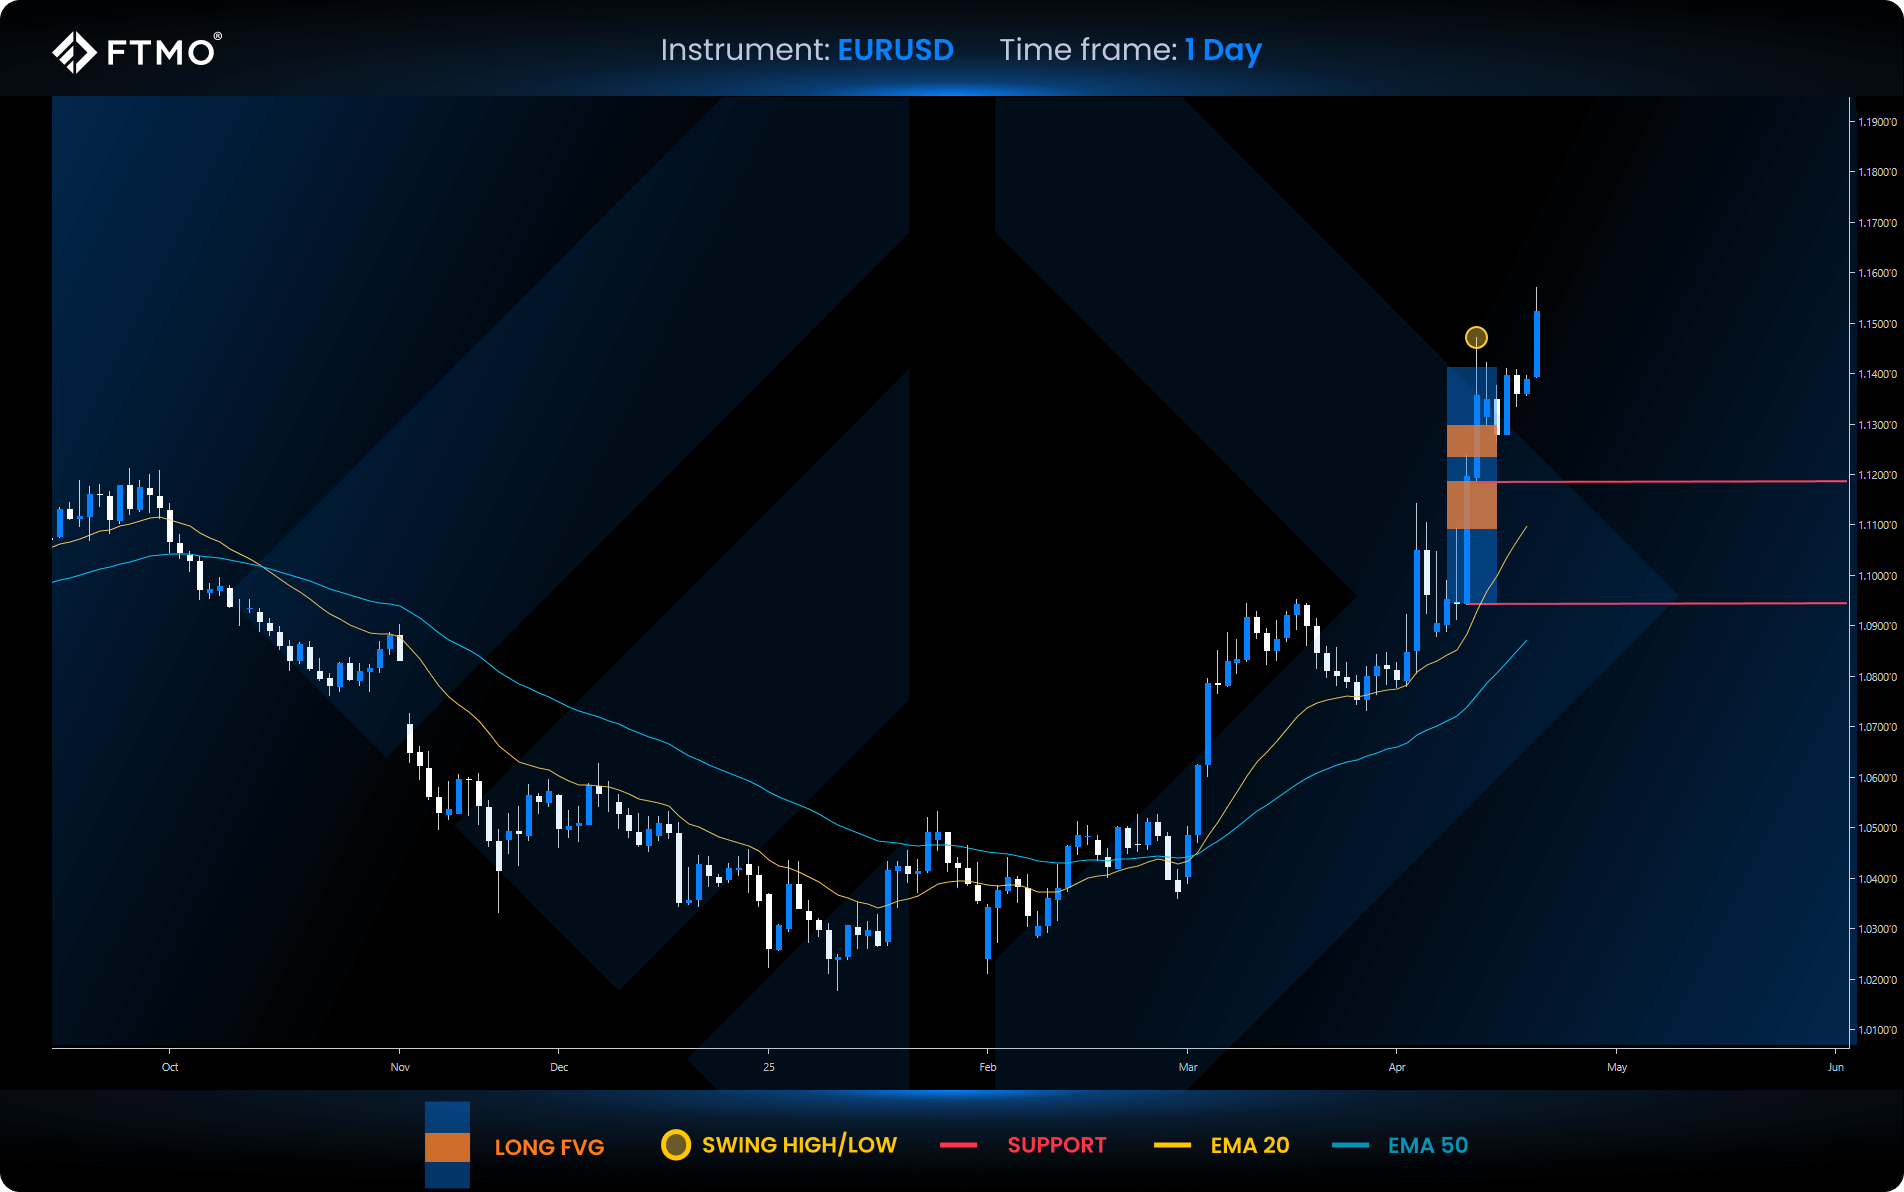
EURUSD
Market Context: EURUSD is currently trading at a yearly high, maintaining a strong bullish trend above the 20 and 50 EMA. Last week’s price action was in line with the prevailing trend, with a strong bullish close on Friday and a break above the recent swing high.
Bullish Scenario (Preferred): If the price continues to hold above key support zones and EMAs, the bullish trend is likely to continue with the potential for new highs.
Bearish Scenario (Alternative): A loss of bullish momentum may trigger a correction towards nearby support zones, which could offer new long opportunities.
Setup: Two FVG setups were identified last week - one remained unfilled, while the other reached a 2:1 Reward-to-Risk Ratio target. No new active setups are present so far this week.
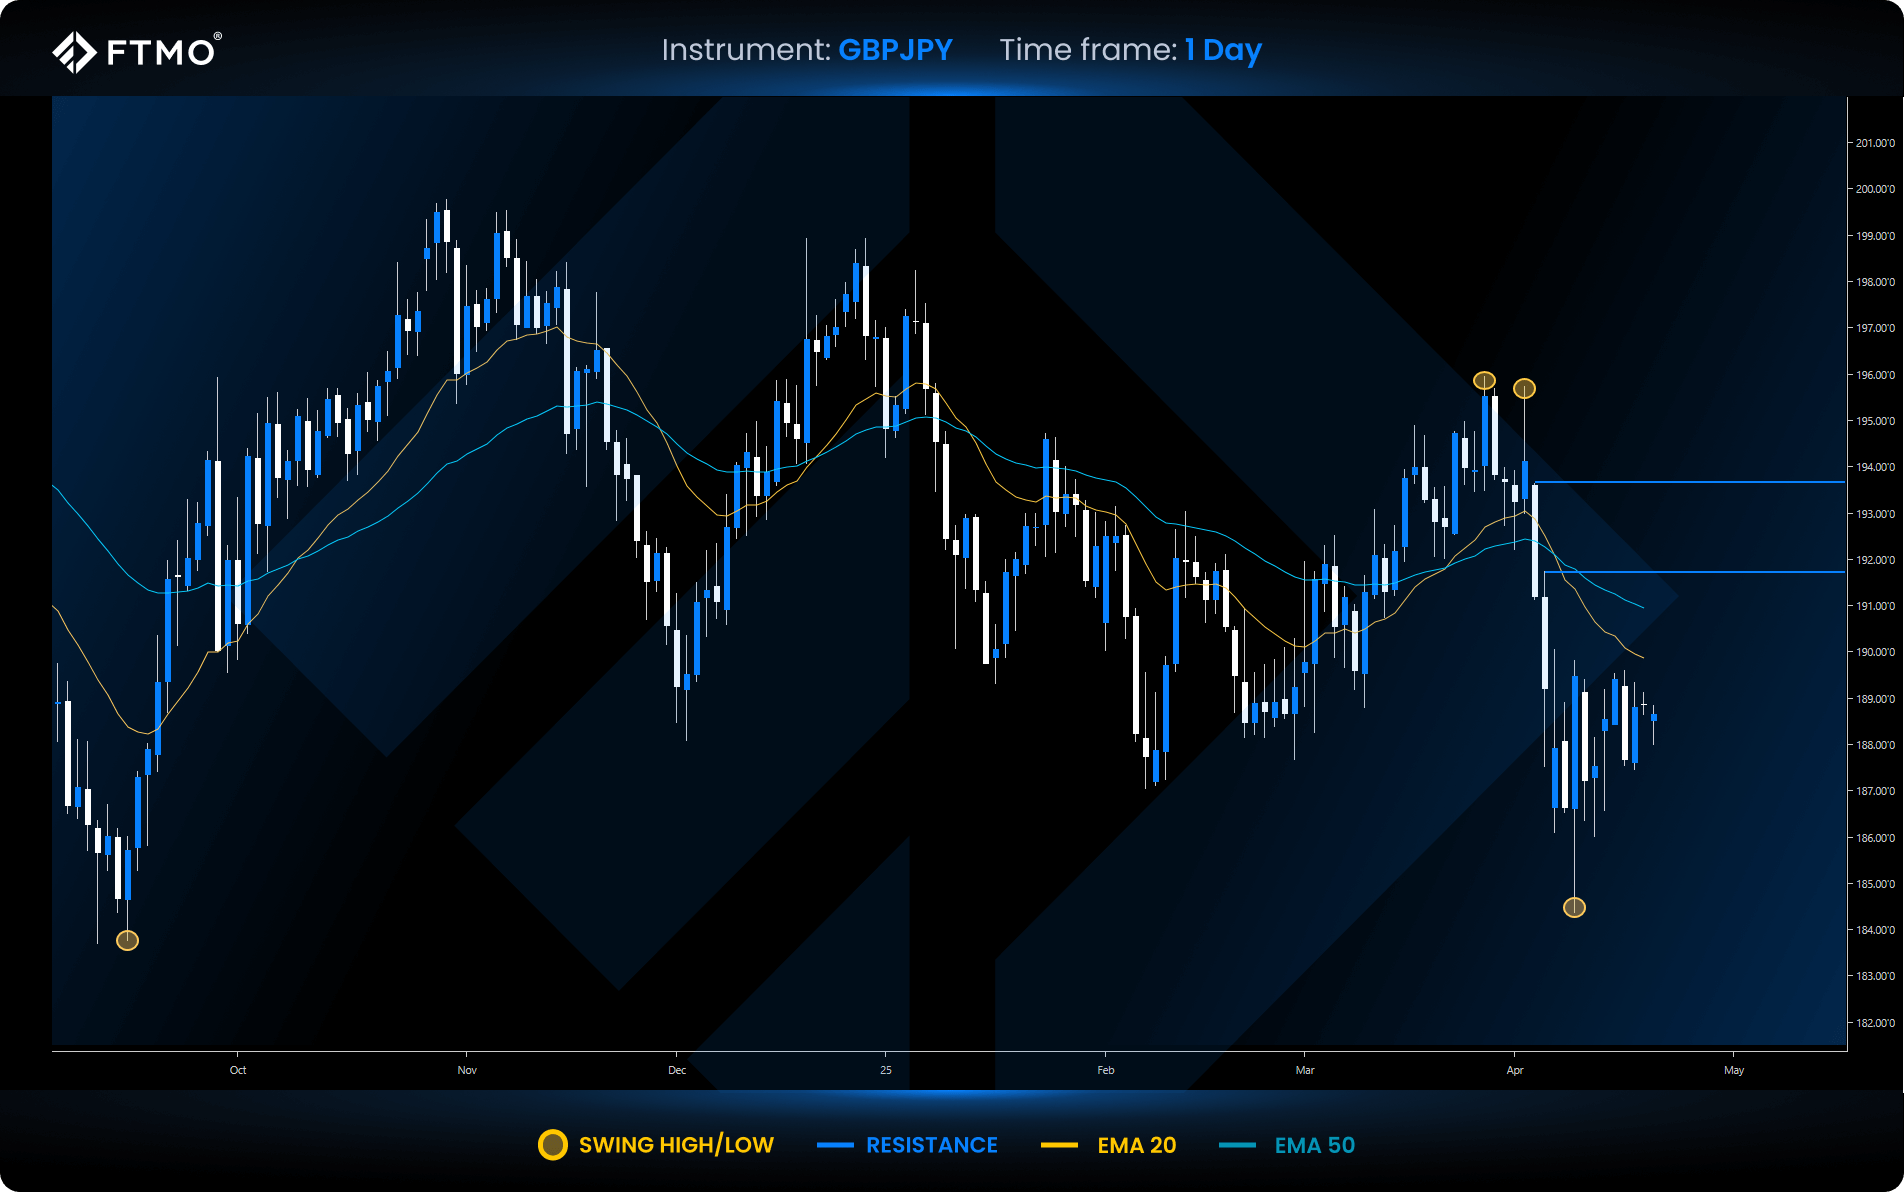
GBPJPY
Market Context: GBPJPY remains in a consolidation phase within a broader bearish structure, with the price trading below the 20 and 50 EMA. Despite some volatility, there were no decisive moves last week, and previously watched imbalance zones (FVG) did not significantly influence direction.
Bearish Scenario (Preferred): A continuation lower is expected, with a potential sweep of the swing low if the market respects previous resistance zones.
Bullish Scenario (Alternative): If the price breaks above resistance and the EMAs, we could see a move toward untested swing highs.
Setup: There is currently no valid FVG setup. The previous bearish setup was not triggered and is no longer considered active.
Opportunities to Watch This Week
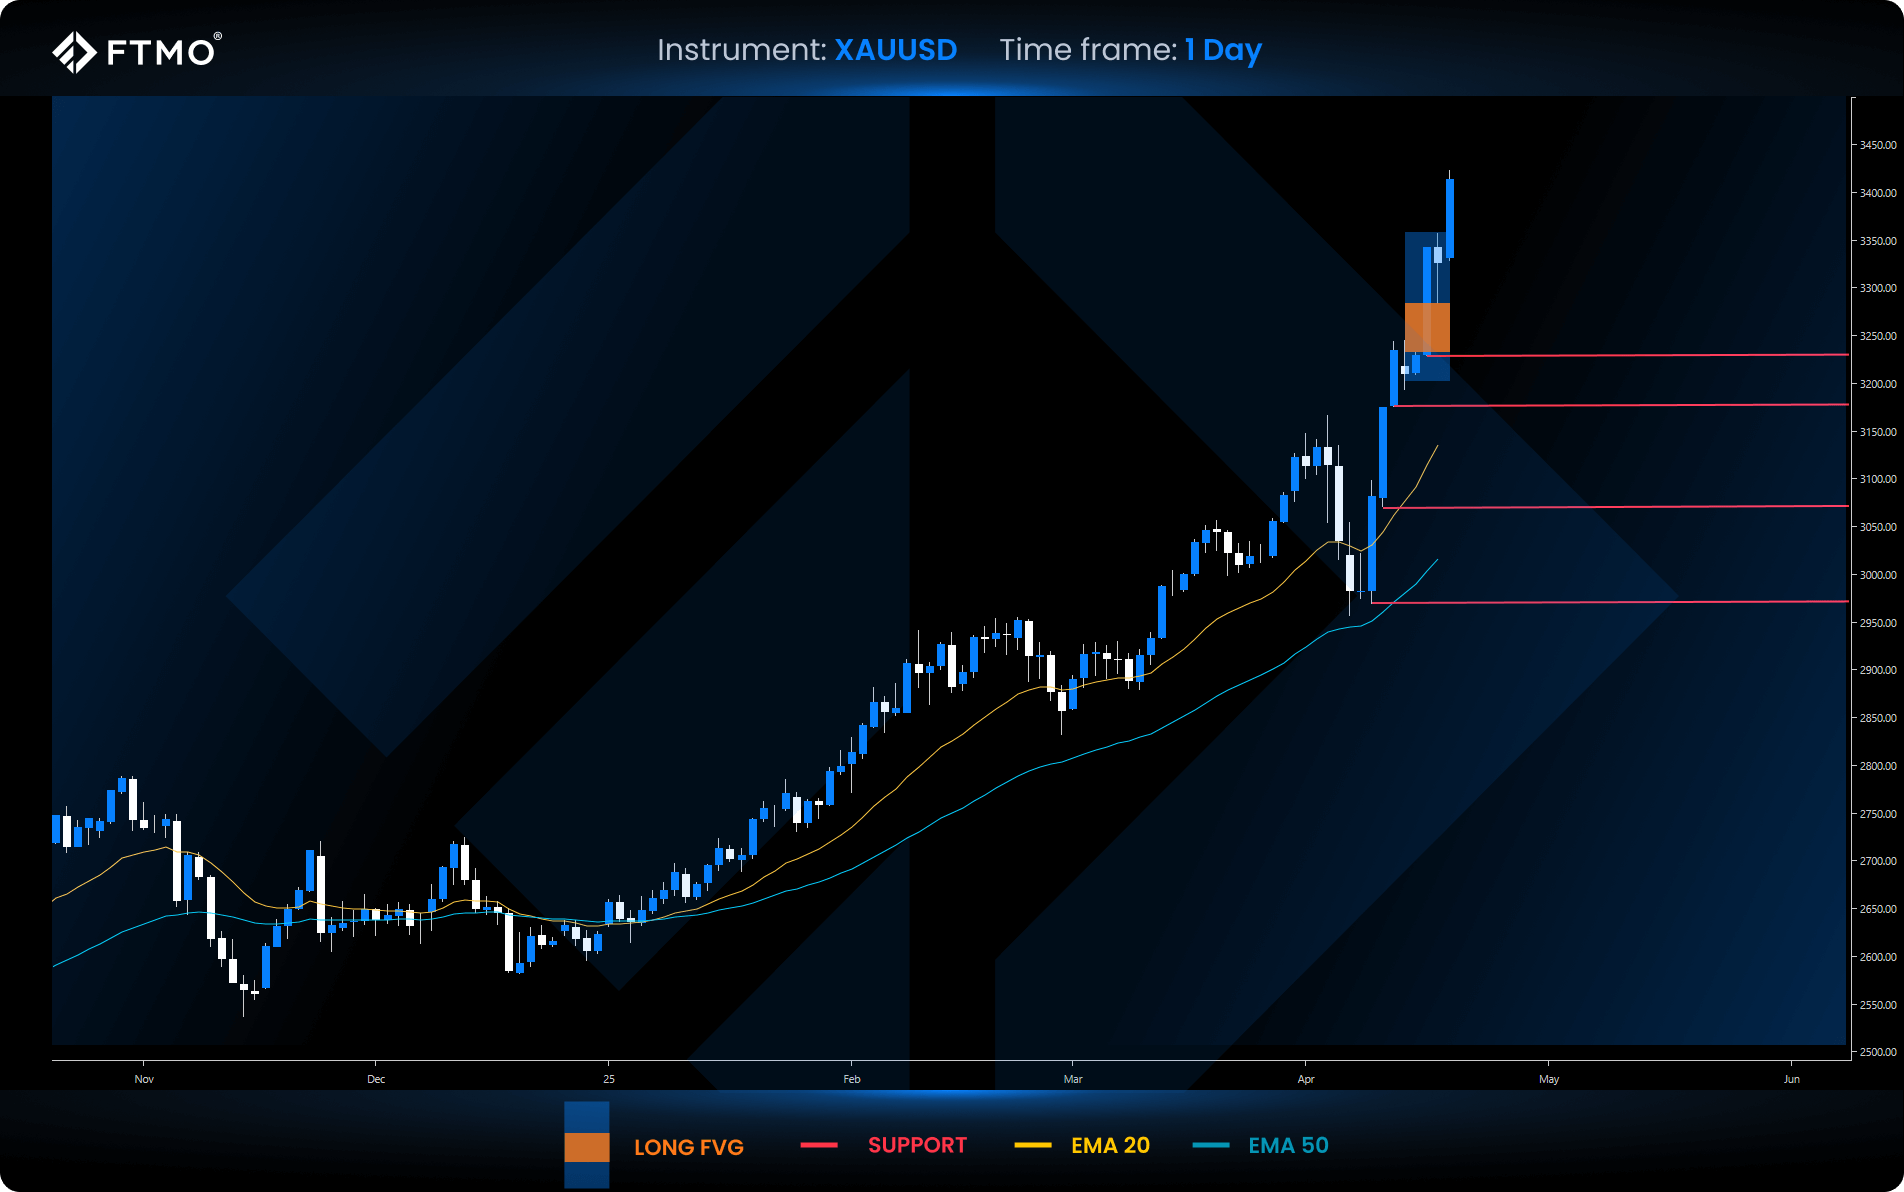
XAUUSD
Market Context: Gold continues its exceptional bullish rally, driven by current geopolitical tensions. There are no visible resistance levels on the chart that would cap further upside. However, rapid rallies like this one often come with sharp corrections toward nearby support zones.
Bullish Scenario (Preferred): As long as there is no full candle close below a key support zone, the trend is expected to remain bullish.
Bearish Scenario (Alternative): A candle close below support could lead to a deeper correction into lower zones, targeting liquidity fills based on FVG methodology.
Setup: A long FVG setup is available this week if price pulls back into the identified imbalance area.
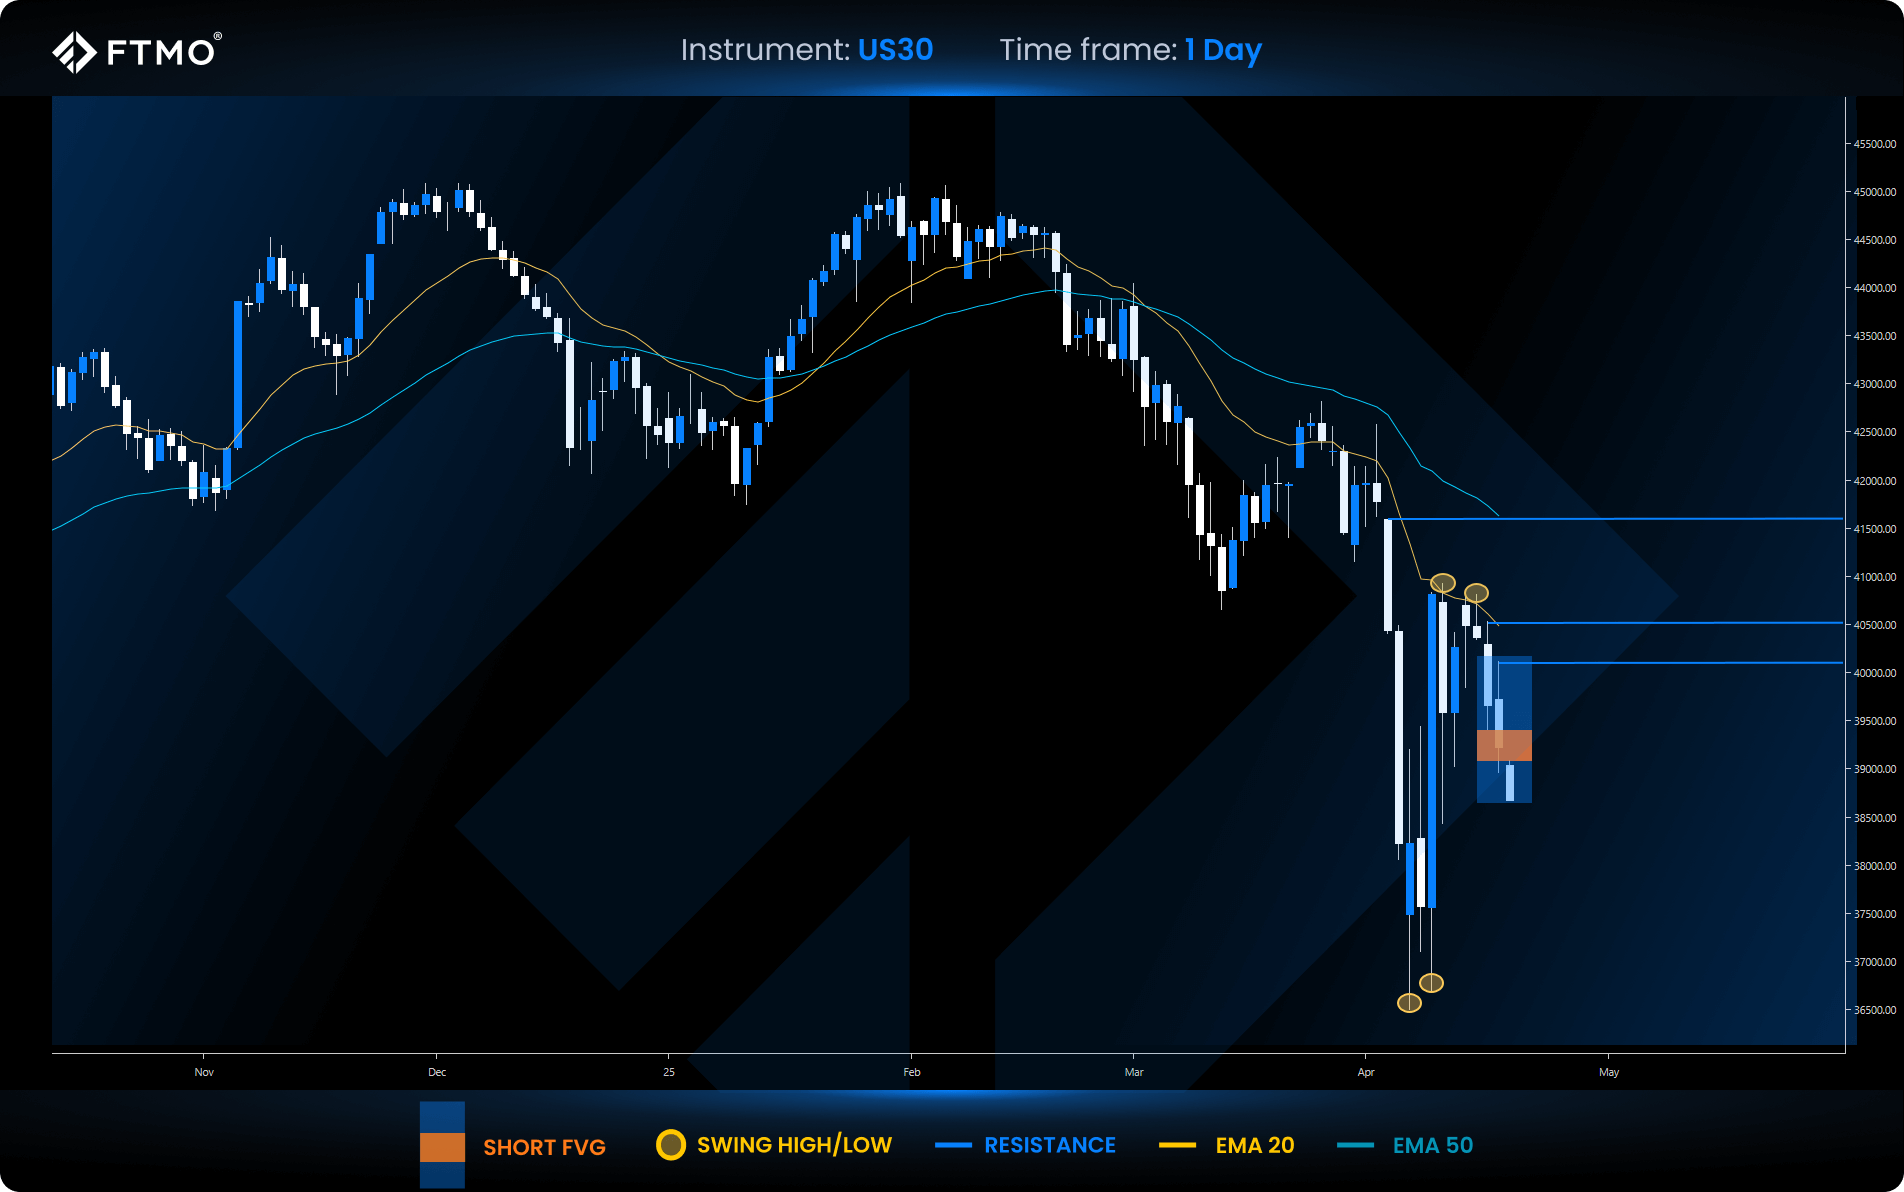
US30
Market Context: US30 is in a confirmed downtrend, with price trading below both the 20 and 50 EMA, a clear indication of bearish market structure.
Bearish Scenario (Preferred): The downtrend is expected to continue, with potential to target lower swing lows. A short FVG setup was formed this week in alignment with this move.
Bullish Scenario (Alternative): If the market stages a recovery, we could see a test of resistance levels and possibly a sweep of upper liquidity.
Setup: A valid short FVG setup has formed this week, with a potential target to the swing low zone.
All information provided on this site is intended solely for educational purposes related to trading on financial markets and does not serve in any way as a specific investment recommendation, business recommendation, investment opportunity analysis or similar general recommendation regarding the trading of investment instruments. FTMO only provides services of simulated trading and educational tools for traders. The information on this site is not directed at residents in any country or jurisdiction where such distribution or use would be contrary to local laws or regulations. FTMO companies do not act as a broker and do not accept any deposits. The offered technical solution for the FTMO platforms and data feed is powered by liquidity providers.
This article is for informational purposes only, and some information may not reflect the current service offering or product features. Please always verify the latest terms on the official product pages.
About FTMO
FTMO has developed a two-step evaluation process to find trading talents. Upon successful completion, you may be eligible for an FTMO Rewards Account with a balance of up to $200,000 in simulated funds. How does it work?