


Trader’s Analysis: long-term statistics you won’t find elsewhere
When you plan to analyse your results and you want them to make sense, the analysis period must be long enough. Trader’s Analysis presents this long-term data in a clear format that offers you a valuable and comprehensive insight into your FTMO trading history.
When developing or testing a trading strategy, good quality data and long-term history are critical for the result to have a meaningful value. The lower the quality of the data source and the smaller the data set, the less valuable the final result of the test or analysis. In real trading, such analysis can therefore do more harm than good.
Trader’s Analysis for all serious traders
We at FTMO are very aware of this and have worked on yet another of the many applications that should help our traders to achieve better long-term results. As the name implies, the Trader’s Analysis is a service designed to allow our traders to analyse accounts that they have traded (or are trading) with FTMO. This way, each FTMO Trader will receive comprehensive statistics covering virtually all of the trades they have executed through FTMO, allowing them to thoroughly analyse their progress with FTMO.

The application can be found in the left column of the Client Area, in the Applications section (bottom of the left column). You do not need to download or install anything to launch it, it is available in a similar way you access the MetriX Application. Just below the initial welcome, you can see the account numbers (for FTMO Accounts, Verifications, and FTMO Challenges) that the analysis will cover. By default, all accounts are selected for the analysis, however, you can change the selection in the option found below.
Set everything up your way
The above section is followed by the Settings box, where you can filter your selection according to predefined criteria. First, you can choose whether you want the chart to show your trading progress in monetary terms or as a percentage.
In the next box, you can specify the period you want to monitor. This can be a period from a certain date to the end (in which case you have to double-click on the selected start date), or you can specify the start and end of the selected period (it doesn’t matter which date you enter first, the end or the start). To deselect, click on the arrow icon.
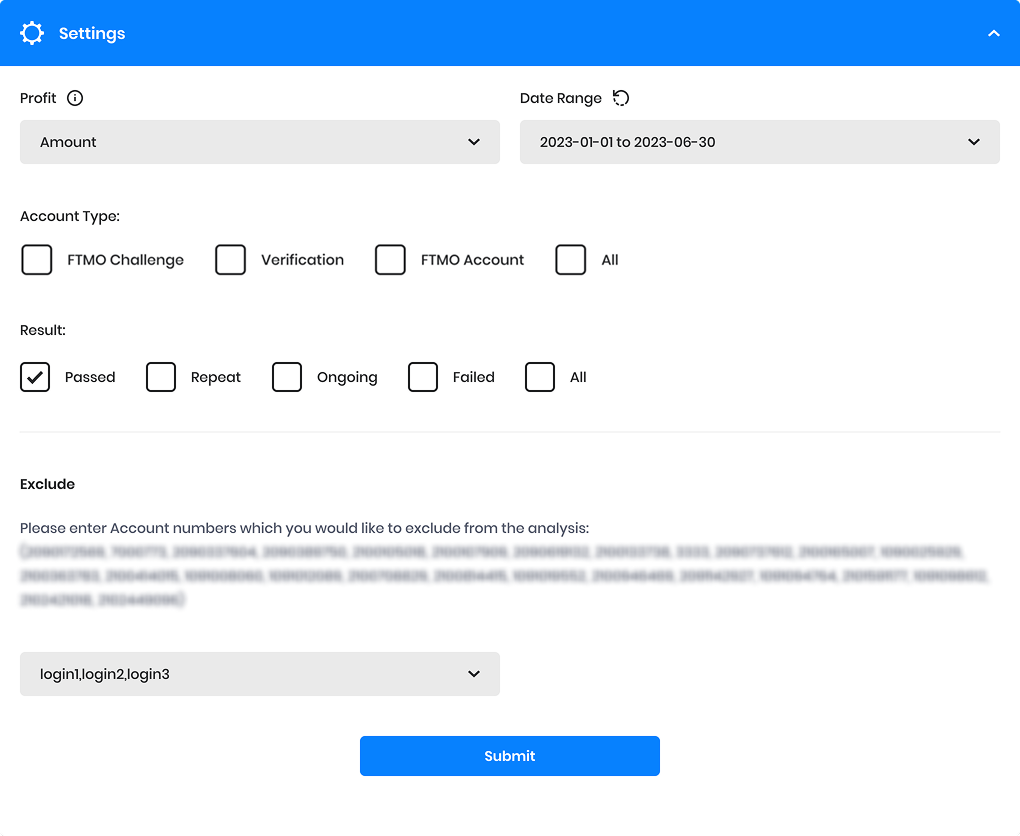
You can then select the account types you want to analyse. The available account types include Verifications, only FTMO Accounts, etc., or you can simply monitor all accounts together (this is the default setting). Similarly, you can then select accounts based on whether they were successful, unsuccessful, or just the ones you are still trading on.
Customize your choice
At the bottom of the Settings section, you can enter account numbers that you would like to exclude from the analysis (exceptionally, you were unsuccessful or used other strategies and the results would be inconclusive, etc.). You can combine the options within Settings so that you can analyse specific periods and accounts of your choice.

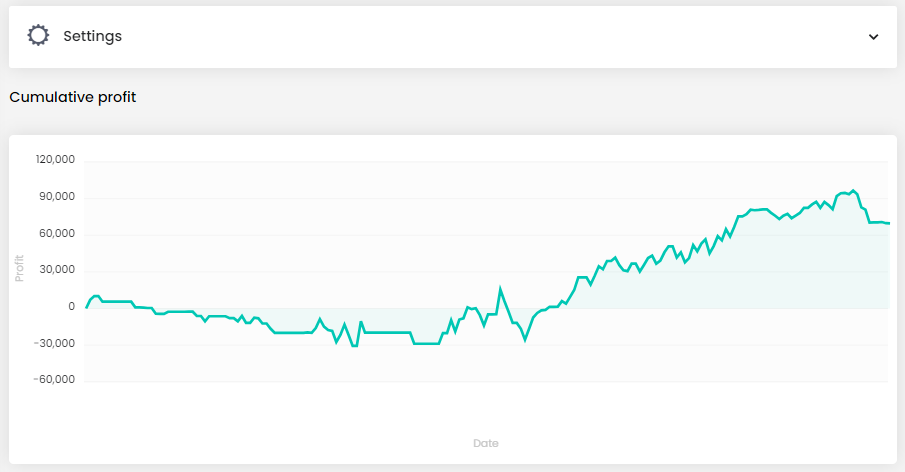
Under the Settings box, you will see a chart that shows the overall progress of your trading, or based on the period you have selected. This chart may look different each time, but it shows you the overall result for the period and accounts you have selected.
In the next section, you will find summary statistics that provide basic data on average losses and profits, trade success rates, RRR, etc. You can also see the percentage representation of each instrument in your trading history.
Which instruments are profitable?
The bar chart below will give you an insight as to which instrument was profitable and which had the biggest losses over the trading period. This is quite important data (the exact number will show up when you hover over the bar), and you can see that when an instrument has a large percentage representation, and poor results, omitting it can improve long-term trading results (and sometimes quite substantially).

As you can see from the above chart, 21.1% of all trades placed by the trader were for the EURUSD pair (green box), which was also his most profitable instrument, which is great. Things are a bit worse for the GBPJPY pair (blue box). 23.4% of all his trades were for this pair, however, it was his most losing instrument. Based on these results, this trader should consider limiting the number of trades he executes for this instrument.

Being more active does not necessarily mean being more profitable
The next two charts show the results and trader’s activity (number of trades) made in each month. As you can see, the worst month in terms of profit (02.2022) was also one of the months when the trader was most active. On the other hand, when his activity reduced in late 2022 and early 2023, it led to his best results. This may not be correlated and may not be a clear rule. However, these are the types of patterns of behaviour that can lead to improved long-term results, after the trader reviews his long-term analysis and adjusts his trading style accordingly.

The next chart shows the average trade duration in a given month, which, of course, will be reflected in the previous activity chart (fewer trades taking longer and vice versa), but may also be reflected in the results. Someone simply has no talent for short-term trading and may thrive by switching to a swing approach, while for someone else the opposite approach may work better.

The next two charts show whether the trader is able to maintain the Reward to Risk Ratio (RRR) at a sustainable level (i.e. above 1) over the long term and how successful the strategy has been each month.

On the last chart, the trader can learn what the expectancy of his strategy is, or what the hypothetical value of his next trades was, based on the RRR and win rate of trades in each month.

Any trader who wants to get an overview of his long-term results and gain an edge in the market should not underestimate the long-term analysis of his trades. We hope that our new app will help you in this endeavor and that it will improve your results enough to achieve what you expect from trading with FTMO.


- As many Free Trials as you need
- Up to $200,000 account
- No time limit

Worldwide Reviews