


Statistics: boring, but necessary for better results
Traders use various tools that help them make their decisions when entering the market. Whether it’s multiple indicators directly on the charts or other statistical tools, the goal is always to make profits consistently. Today, we’ll look at how to use statistics and probability in your favour to achieve better results.
Technical analysis and trading in general are based on statistics and probability. The cornerstone of success for any trader is finding an edge that helps you achieve consistent returns. Although statistics is considered boring by many people, a systematic approach based on data and statistics is an essential element necessary for long-term success for a profitable trader. In order to use statistics and probability to your advantage, you must have reliable data and a tool that will assist you with processing the data and reflecting the outcome on your trading.
Traders can do these things manually, but it is time-consuming and inefficient. Instead, many investors use various programs available on the internet. Large investors have their own specific solutions developed by several departments in their firm. And then there’s another solution, exclusively for our traders.
FTMO Statistical application
FTMO also strives to offer its traders the most comprehensive solution possible and therefore our Statistical Application uis now available to all traders directly in the Client Area. This tool has recently undergone a major update that makes it more accessible and understandable to a broader number of traders. Let’s discuss some of the new features and improvements in more detail.
The Statistical Application (StatApp) is divided into two main sections: Market Analysis and Symbol Analysis. Market Analysis focuses on statistics related to all instruments available to traders on FTMO’s trading servers, while Symbol Analysis focuses on specific data about individual available instruments. In the tables and charts, we use data gather for the last 52 weeks, which is a sufficient sample to offer traders an overview of the behaviour of the markets and individual symbols as well.
Market Analysis
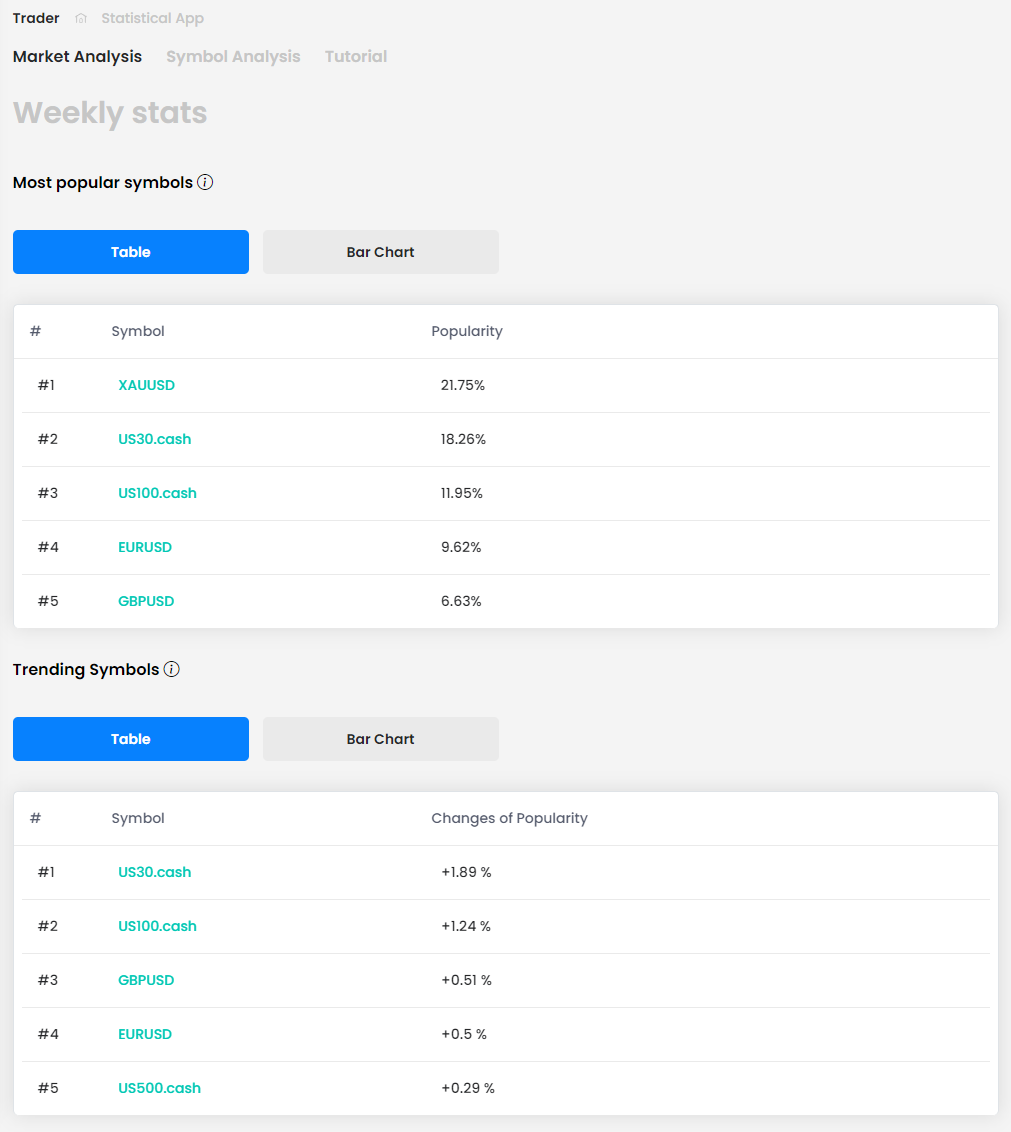
In the Market Analysis section, traders have access to weekly statistics. The first section offers an overview of the most popular instruments traded at FTMO in the form of tables and bar charts. Unsurprisingly, gold leads the way, but what is a little surprising is that the EURUSD pair comes all the way back in fourth place. We also have statistics focused on the change in popularity of each instrument (Trending Symbols).
The Highest Gain statistic shows the instruments with the largest absolute (in numbers) and relative (in percentage) difference between the opening and closing price over the last week. The Highest Gap, on the other hand, shows the instruments with the largest difference between last week’s closing price and this week’s opening price, both in absolute and relative terms. Instruments with significant gaps should be watched out for by swing traders who keep positions open over the weekend.

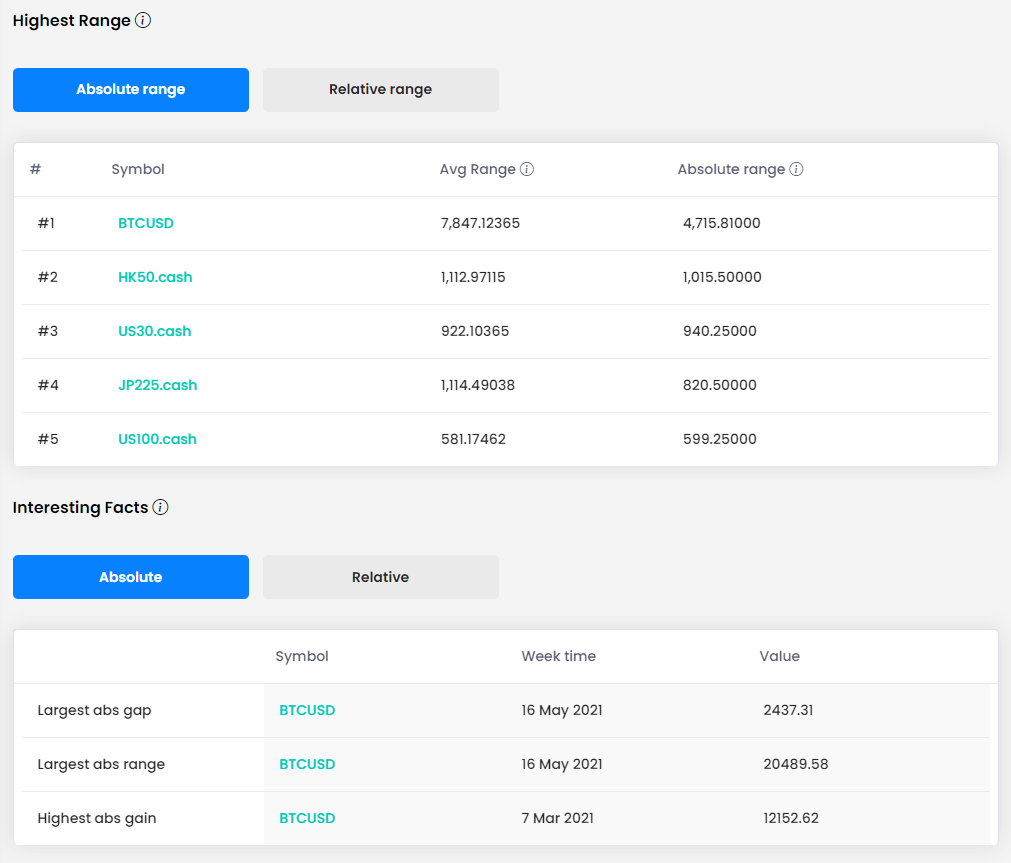
The Highest Range shows the instruments with the most significant difference between the weekly high and low, i.e. with high volatility, which is sought by traders who require more intense market action. Finally, the last table shows exciting facts regarding the largest appreciation, gap and spread over the previous 52 weeks. Unsurprisingly, bitcoin leads in absolute terms. However, the relative terms are not so one-sided.
Symbol Analysis
In the Symbol Analysis section, we offer our traders a range of exciting and practical information about individual instruments regarding volatility and appreciation. The trader can thus monitor the probability and possible scenarios of the behaviour of all instruments available at FTMO.
Right from the start, the trader has data on each selected instrument regarding the current gap size (gap size over the last week), average gap size (avg. gap size for the previous 52 weeks), current gain (price change compared to last week) and average range (difference between high and low during the last 52 weeks).
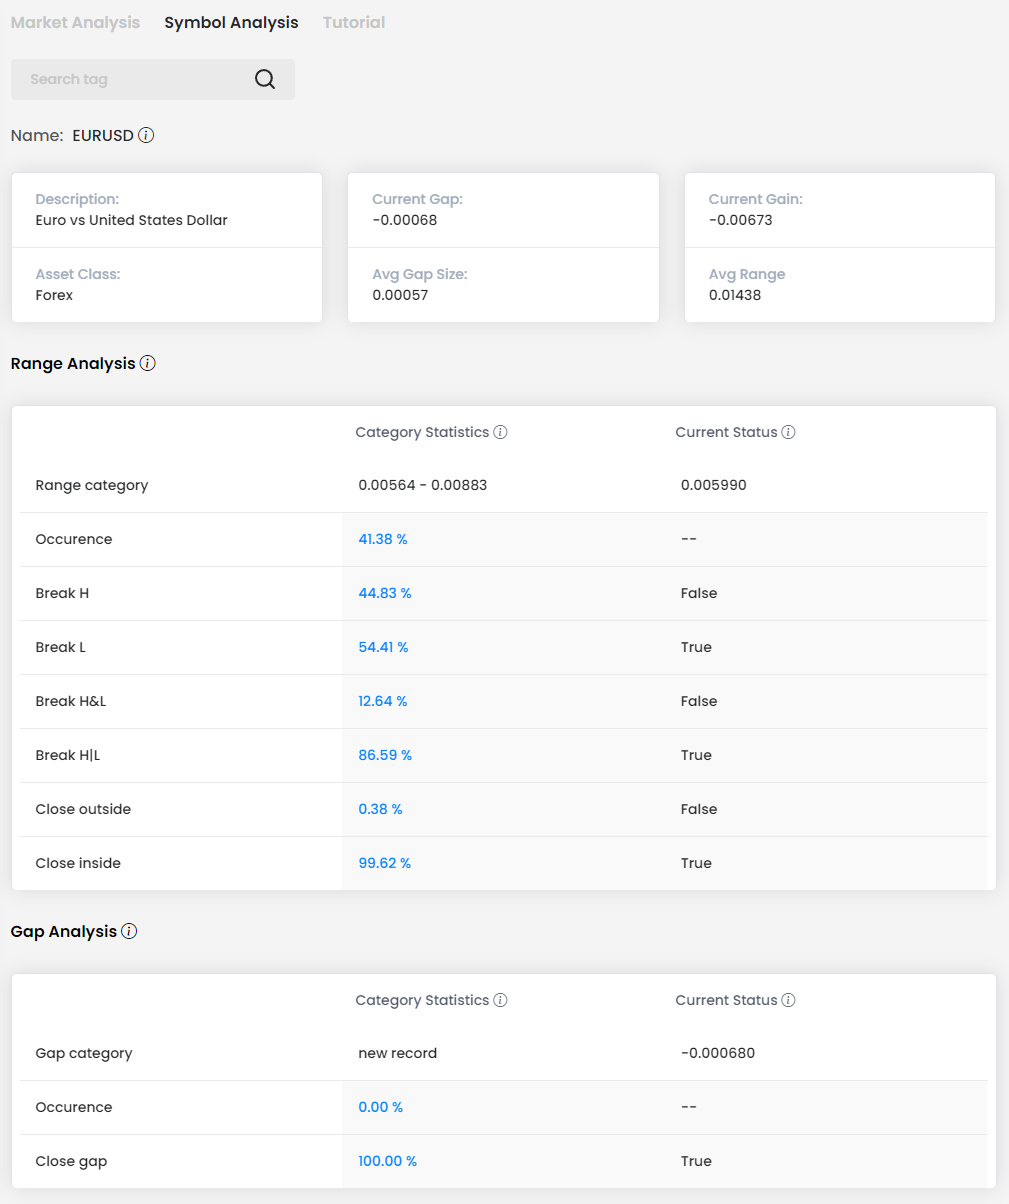
The Range Analysis section shows detailed and beneficial statistics regarding the range of movement for a given instrument over the previous day, offering an excellent overview of the daily instrument volatility. We provide our traders with data on the given range, how often such a range occurs in the market, how often there is an upward or downward breakout in the following day, how often the range can be broken in both directions or only one direction, or how often the price closes within the range or outside the range. At the same time, the trader has an overview of whether the breakout has already occurred (true) or not (false).
Finally, Gap Analysis shows the weekly gap for the selected instrument. The trader has an indication of the last gap, the probability with which it may occur, and the probability that it will close. Holding a position overnight, and especially over the weekend, can lead to the formation of gaps, and some instruments are more prone to forming these gaps (especially index instruments or instruments with lower liquidity). With our statistical application, a trader can better understand the probability of such a gap forming and can manage his trades accordingly.


- As many Free Trials as you need
- Up to $200,000 account
- No time limit

Worldwide Reviews