

Forex Strength Meter - How to pick the best trade!
We have received this very interesting article from one of our followers. The article starts with a brief explanation of FX movements, which serves as a good reminder to all. The main part of this article is dedicated to the analysis of a strength / weakness of any individual pair. This approach can be used for smaller and higher time frames, giving traders a possible idea of how to add a meaningful confirmation to their trading system.
Currency and Currency Pair
In this article, we will talk about currencies and currency pairs, so let's first define what do we mean by them. As we all know, currency pairs such as EURUSD, USDJPY and many others - a currency pair is the quotation of two different currencies, with the value of one currency being quoted against the other. In the pair EURUSD there are two currencies involved the Euro (EUR) and the US Dollar (USD). The price/quote of EURUSD represents the value of the Euro (EUR) against the US Dollar (USD). This article is about individual currency strength, to understand the movement of the currency pairs involving that particular currency.
Why It Is Important?
The movement of a currency pair depends on the relative state of two individual currencies. EURUSD price 1.1500 means that 1 Euro (EUR) is now trading at 1.15 US Dollar (USD). This price goes up and down for many reasons. The price may rise if the EUR gets relatively stronger than USD and can fall if the EUR gets relatively weaker than USD. That can happen in many ways. For a price rise of EURUSD the EUR has to get stronger while the USD strength remains unchanged, or the USD has to get weaker while the EUR strength remains unchanged. For a price fall, the situation will be vice versa.
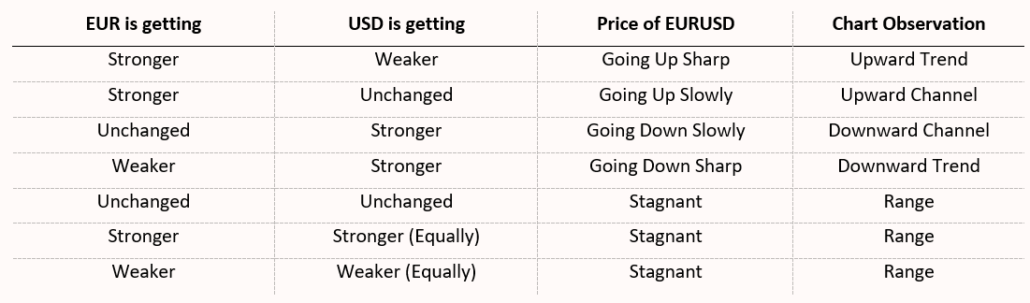
Currency table
The table above is showing the most common scenarios that happen to a currency pair price when individual currency strength shifts from a stronger to the weaker stage. If we can understand the individual strength and weakness of a currency, we will get an edge on trading the currency pairs of that currency. We will be able to decide on continuation or reversal forecasts. We will be able to take advantage of the pullbacks of a trend, slope lines of a channel and volatility/spikes of a range.
It is not possible to understand the strength and weakness of an individual currency by looking at one of its pair's price. But it is possible to understand the strength/weakness standpoint of a currency when we look at it with a holistic view. In the next paragraphs, we will discuss about the methods of understanding currency strength/weakness.
Strength & Weakness
How can we measure the strength and weakness of an individual currency? There are several methods of doing this. We should choose a method according to our objective because some methods are very complex and suggest the use of expensive software and services. Our objective here is simple - to add an extra edge with our existing trading systems. We will go the easy way for this analysis, though it may not be mathematically accurate but will give us the required understanding. This will be a visual process.
We always observe price moves with higher highs and higher lows in the upward direction and lower highs and lower lows in the downward direction. Of course, sometimes the price makes a range while no new high or low is registered for a long time. In this analysis, we will look for highs and lows of different pairs of currencies and will try to understand the synchronization of the movements.
Let's take the Pound Starling (GBP) as an example of our analysis. It is a major currency pair and it is a heavily traded pair. It has minor and cross pairs will all the major currencies. Most brokers offer at least 11 pairs of currency pairs involving GBP.
As of 2019-08-16 below are the rates of the common GBP pairs:
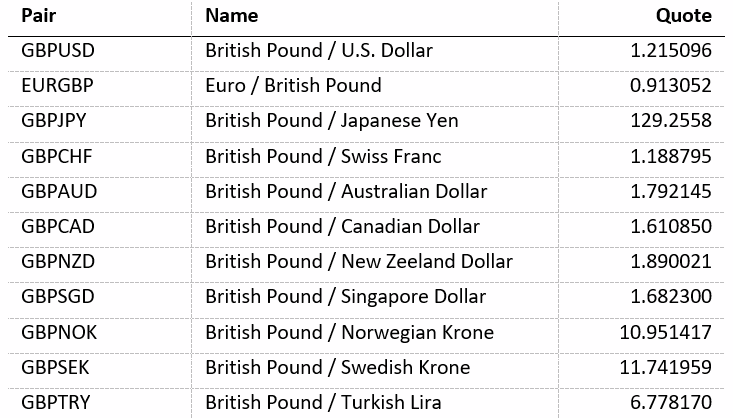
Now, if our existing system or our existing analytical method produces an opportunity of going long or short on any of the GBP pairs, a holistic view can help us to make more confident decisions. The image below is showing charts of 8 GBP pairs. The charts are of daily (1D or D) timeframe and are showing the period from mid-July to mid-August. The 2nd chart from left is showing EURGBP. We have to consider the chart as reverse to compare it with other pairs as there GBP is the quote currency.
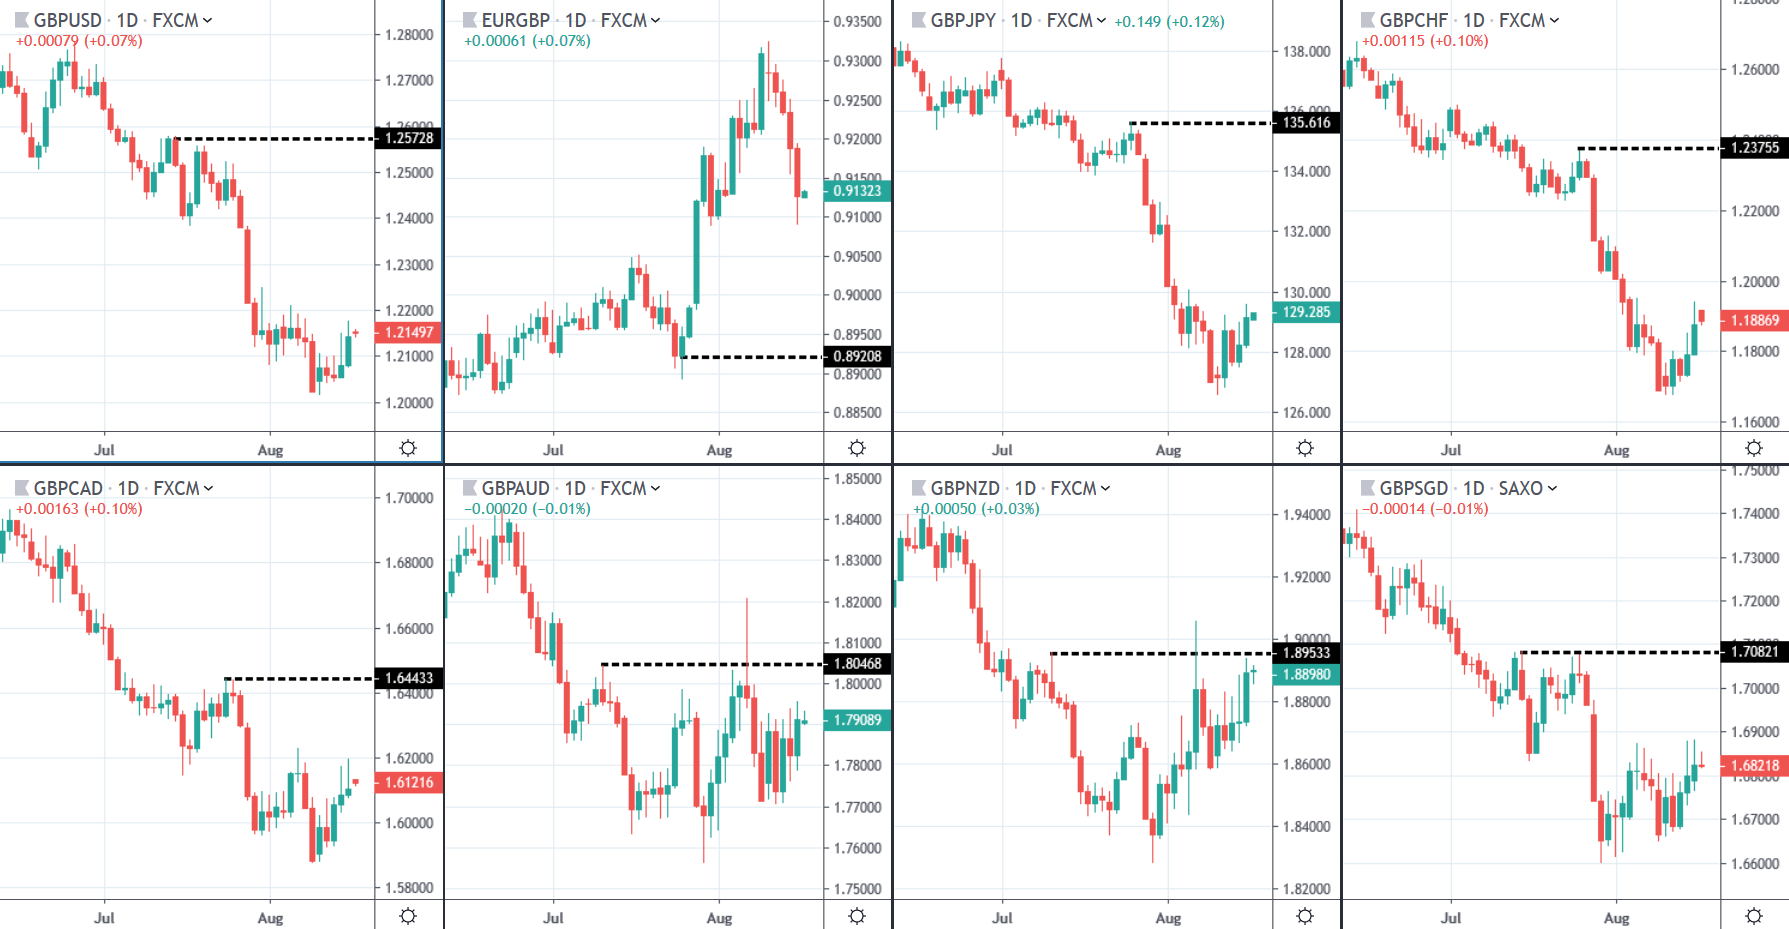
GBP Pairs
In these charts, we can see the pairs marked several new highs and lows. It is visible in almost all the GBP pairs in the charts that are flowing downward movement with lower highs and lower lows (EURGBP upward because GBP is the quote currency there). It can mean GBP is getting weaker or all the other currencies are getting stronger for different reasons at the same time. It takes just common sense to understand that GBP as an individual currency is getting weaker according to these charts. Surely, different charts are showing different levels of weakness. The GBPCHF fall was too sharp with no pullback, GBPCAD offered two tiny pullbacks while GBPNZD is ranging and attempting to break a very recent high. Though the overall direction of GBP is downward in these charts, the very recent movement of last 7 days is showing either a pause, a pullback or a reversal of the downward move.
The dashed horizontal lines on the chart show the last high attempts or the last highs the pairs made. We can see the distance from the last high is not similar in the pairs. In GBPUSD and GBPJPY the gap seems too large while in GBPAUD and GBPNZD the gap is very low. From a broad view, until all price stays under the dashed line, we can assume GBP as a currency is weak. If our system or method generates any signal that tells us to go long in any GBPXXX pair for a prolonged time and the profit target is above the dashed lines, we know that will not be a very good idea. When 3 or more pairs will break the lower- high lower-low sequence and will start the higher-high higher-low sequence, that time we will look for a reversal movement in other pairs and target profits in the upward direction. But there is no clear higher high sequence there and the lower lows are under progression. Now as GBPAUD and GBPNZD are showing a range movement, it means they are quite equal in terms of relative strength with GBP. Let’s see the charts of the AUD pairs.
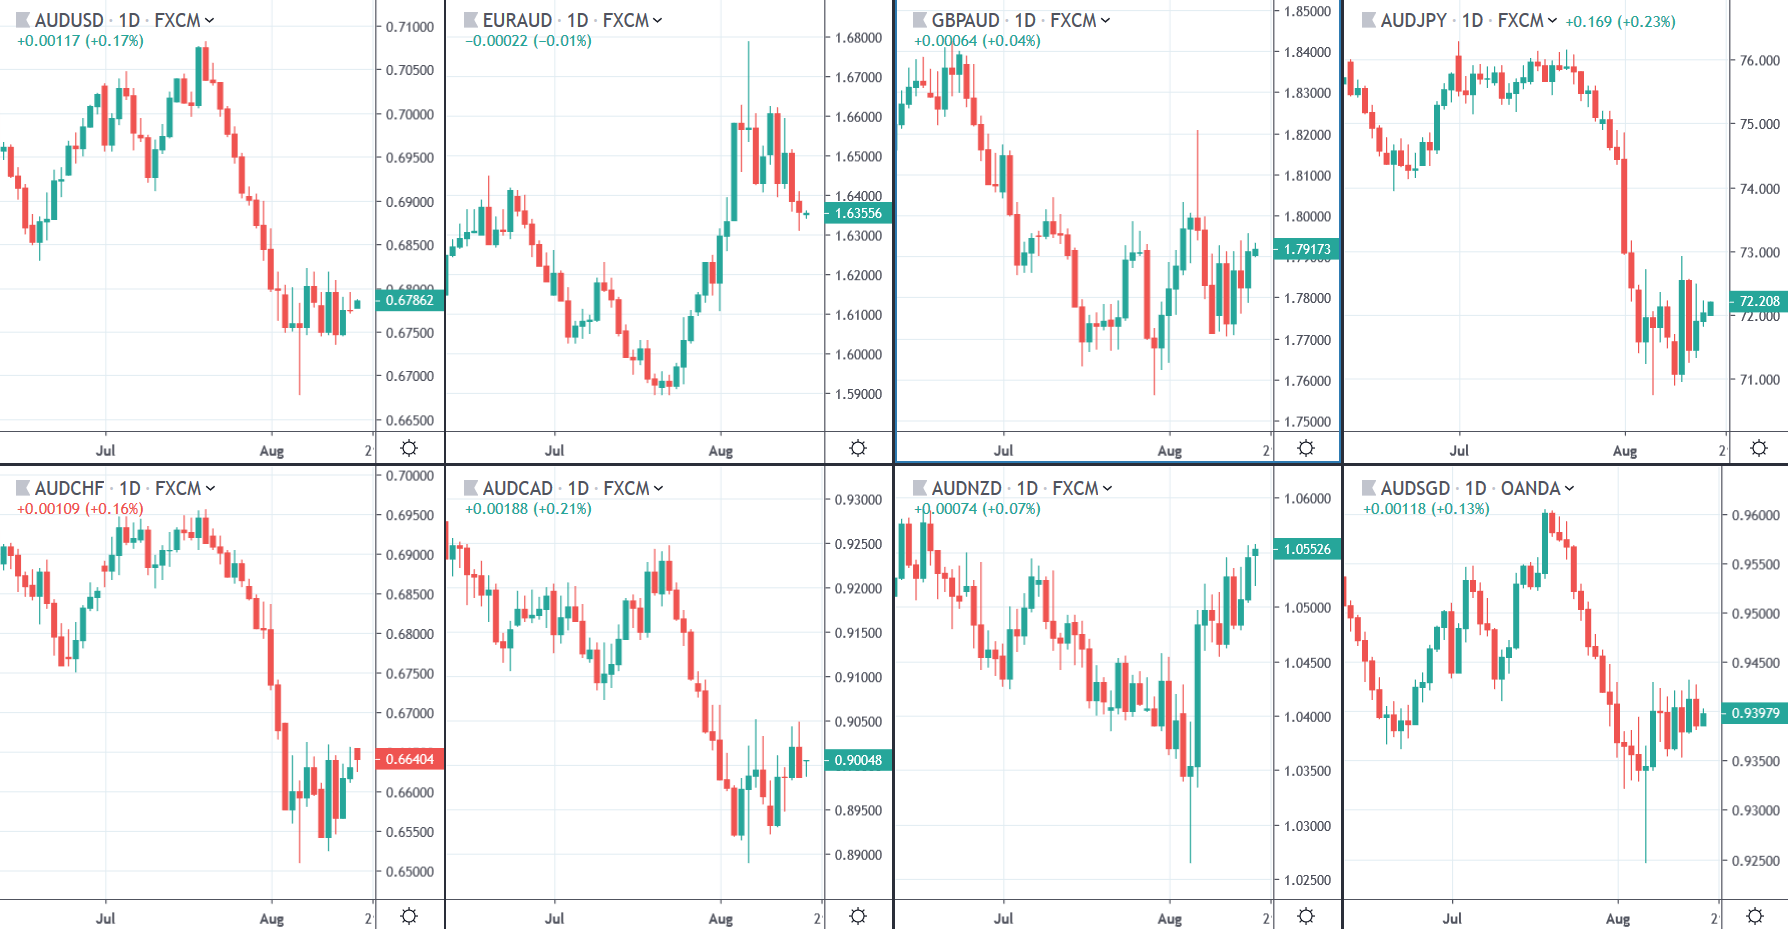
AUD Pairs
The AUD pairs are showing weakness in overall view but the weakness is not similar to the GBP pairs. It was more like a rise at the starting of the chart and a fall started from the mid area of the chart. Unlike the little pullback of last 7 days/candles of the GBP pairs, AUD is showing stagnation. Just looking at 2 setups we can now see that GBP and AUD are showing weakness in respect of the other currencies. And surprisingly by analyzing these, we can clearly see that the USD, JPY and CHF are the strong currencies, at least against GBP, AUD and NZD. This can open the window of opportunity for us as well. Let's see the charts of JPY for instance.
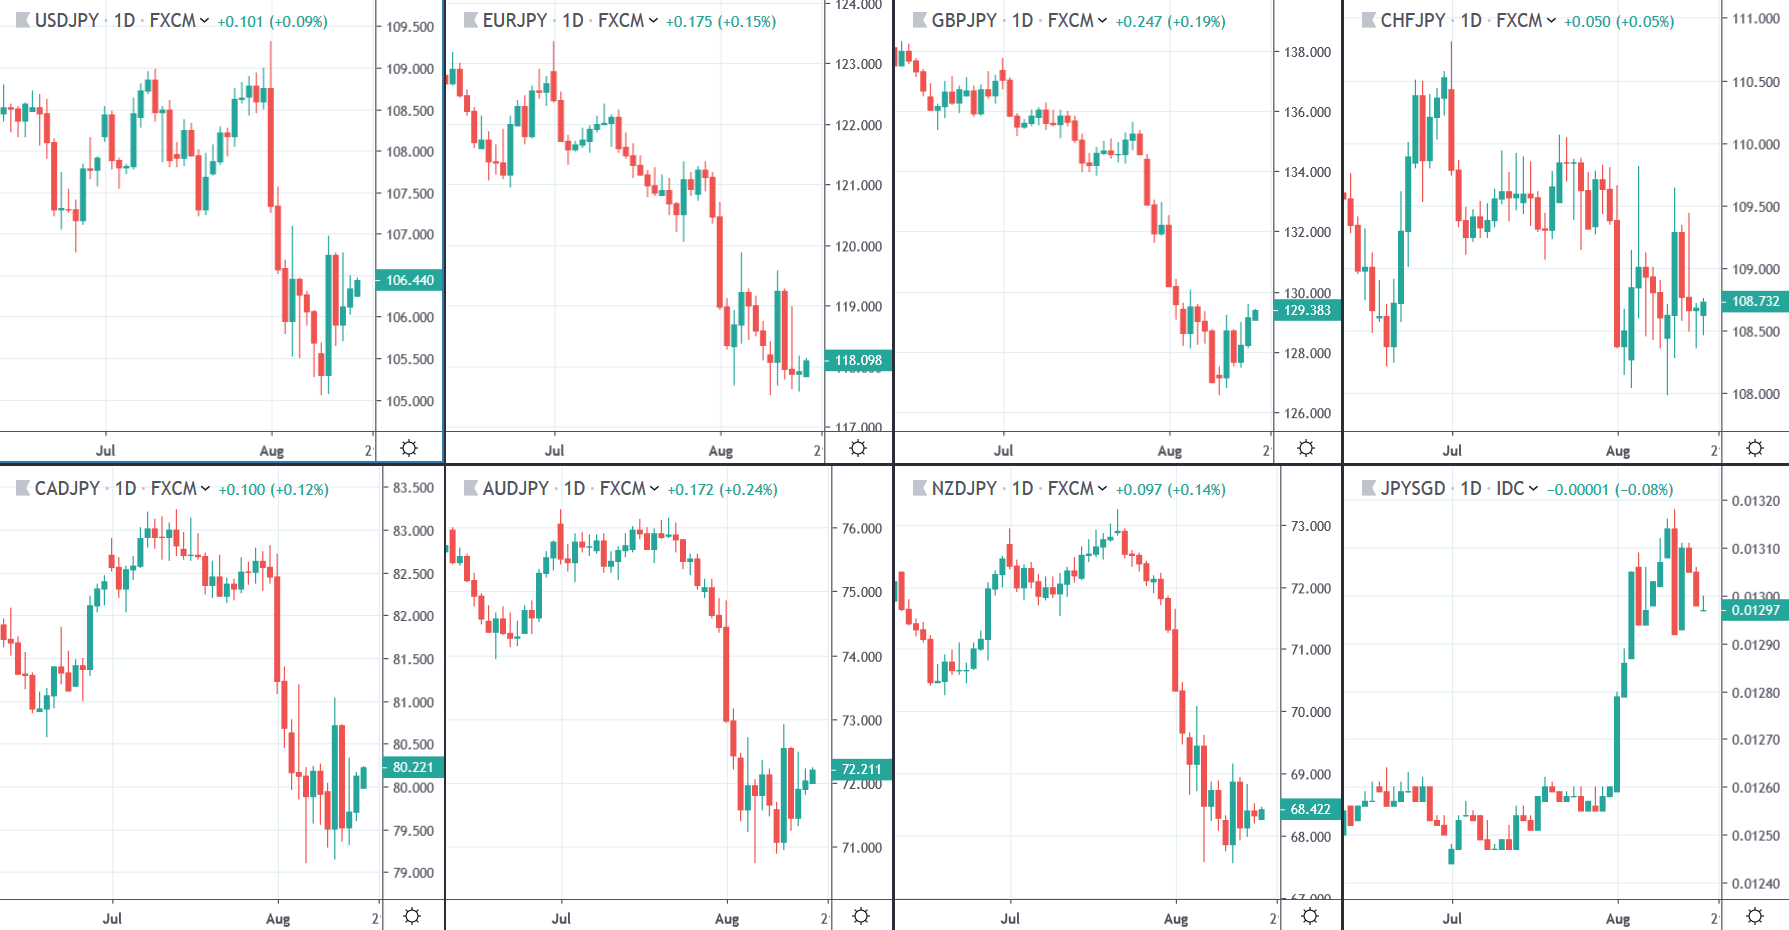
JPY Pairs
The JPY pairs are clearly indicating that it is maybe the strongest of the major currencies, equaling with CHF JPY has created a strong and sharp move throughout the charts.
So far with a holistic view in small time, we got to know which currency has the upper hand and which has the lower hand in the market in our analytical time period.
How This Analysis Can Help
This analysis can be helpful in many ways. Before making the points here, let's be clear that this model of analysis is fractal in nature just like the timeframes. As we know, the chart creates meaningful patterns with highs and lows in every timeframe, the main principle of analysis is the same in every timeframe. Though the accuracy of forecasts and results may vary from the longer to shorter timeframes. We can actually apply this analysis to any timeframe. Now let’s discuss the ways we can use this analytical method.
- Confirmation: This strength measuring visual method can act as a confirmation tool for any trade. Suppose our system suggests a short on GBPCAD pair where the estimated holding period will be 10 to 15 days with an expectation that GBPCAD will create a new low or at least will test the recent low. We know the overall strength of GBP is weak and we know where to put our stop loss and we will also look for GBP reversals on the other charts. If we see 3 or more charts have been reversed and our trade still didn’t hit the stop loss or profit target, we can think of taking profit before hitting the take profit level or cut the losses before hitting the stop loss level. If our system suggests short on GBPAUD and GBPNZD, we will be able to choose disparately because we also know the relative strength of AUD and NZD, and that will tell us how much weight we should put on each pair. That will enable us to size our positions more wisely and diversely.
- Spotting Trading Opportunity: Though it is not recommended to use this analytical method as a standalone tool, but it can be used to search and spot good trading opportunities. From the visual analysis of our example charts, we know JPY is a strong currency and GBP is a weak currency in our study time period. So according to the example charts and our model GBPJPY can be a good trading opportunity. Usually, this kind of strength/weakness match makes large pips differences. But usually the volatility and the decision speed become a problem if we fail to spot them very early. Generally, the pairs involving one significantly strong or weak and one neutral/ranging currency often give us some wonderful trades. And they are easy to trade than the strong & weak matches. Again, this analysis is to see the market from a holistic view, the opportunity spotting process should become with proper experience with this method. The most successful outcome from this analysis is long term price movement forecasts.
About FTMO
FTMO developed a 2-step Evaluation Process to find trading talents. Upon successful completion you can get an FTMO Account with a balance of up to $200,000. How does it work?.