


A big test of Algorithmic trading. Does it work?
Algorithmic trading is becoming extremely popular among retail traders nowadays and so we decided to go really deep and test whether it works or not. The outcome might surprise you. In the below article, we’ll show you how to build your own Algorithmic trading portfolio and the trading results that we generated after one year of real-market testing.
You might have seen the term Algorithmic trading already. Algorithmic trading, or as referred to as Algo trading as well, is a type of trading that uses software to run complex mathematical formulas for trading.
There are many kinds of Algorithmic trading software out there, depending on whom they are built for. Many large hedge funds and institutions run their Algo trading machines, which are packed with sophisticated equations, including professional tools and features and programmed in a way to earn profits. These machines need to be supervised around the clock and the humans are only overseeing them and ensuring proper functionality.
On the other side, there are Algorithmic systems for wider use of retail traders. In short, every ordinary trader can purchase the software for a couple of hundreds or thousands of dollars and start programming on its own. Often, these platforms don’t even require you to have any programming knowledge or skills as the coding is fully integrated.
The interface can be very user-friendly so that you can develop your own portfolio or robots that will behave as desired.
How to build an Algorithmic trading portfolio?
 Creating your own Algo-based system then sounds very easy, right? Actually, it is not as easy as one would think. Finding a profitable portfolio is not a piece of cake. You require to spend hours and days filtering bad systems from those which have some potential to succeed. Those of the systems that pass your filter need to be retested again before moving into another stage of development. This includes retesting, Monte-Carlo testing, Robustness test, Optimization, Walk-Forward testing, demo testing, and live testing. I’ll go briefly through some of these phases:
Finding a large pool of candidates
To start, you normally need to create a set of rules or parameters that your algos will run on. In other words, you need to define your trading plan that the system can take into account while computing variations for a profitable system. These can be any of the indicators, time periods, trading logic combinations, range settings, candle computations, entry & exit rules, price values, order types or custom indicators. You also define your money management here. With many programs, you can create your first systems by genetic building combinations or by random variations of the above building blocks.
Retesting
Your initial pool of candidates needs to be further worked with. It is now necessary to filter out the systems that don’t have good properties. A major concern should be the stability of the equity curve, small drawdowns, high profit factor, Return/Drawdown ratio and Win rate. If any system or strategy lags in any of these parameters, it is likely that the performance will not be good in the real market either and that’s why it’s better to eliminate such system. The candidates that pass the initial generation need to be plugged into a retester with tougher parameters and best possibly another data sample. It’s important to mention that having good and quality data is a paramount of successful generation and backtesting. A good data isn’t for free and you normally need to purchase the data from external source. If your market data has flaws, your generated algo systems will result in improper quality.
[av_promobox button=’yes’ label=’FREE TRIAL’ link=’page,1405′ link_target=’_blank’ color=’custom’ custom_bg=’#104a8e’ custom_font=’#ffffff’ size=’large’ icon_select=’yes’ icon=’ue82b’ font=’entypo-fontello’ av_uid=’av-sgyhh9′]
Can you pass our Trading Objectives to receive money for Forex trading? Try our Free Trial to get started.
[/av_promobox]
Robustness test
This phase is often included in the retesting stage itself. The purpose of Robustness test is that you put your systems through a series of market attacks or unexpected situations. The robustness tests let you determine which strategies are most likely to be profitable in real trading and also how vulnerable they are to possible changes, such as a change of volatility, slippage, etc. The robustness test can be combined with the so-called Monte Carlo simulation, which is a simulation technique that forces the impact of risk and random influence and impact of unforeseen variations that endanger the entire system. Robustness testing can randomize skipping trades, changing history data, randomize spread and slippage or randomize system inputs or functionality.
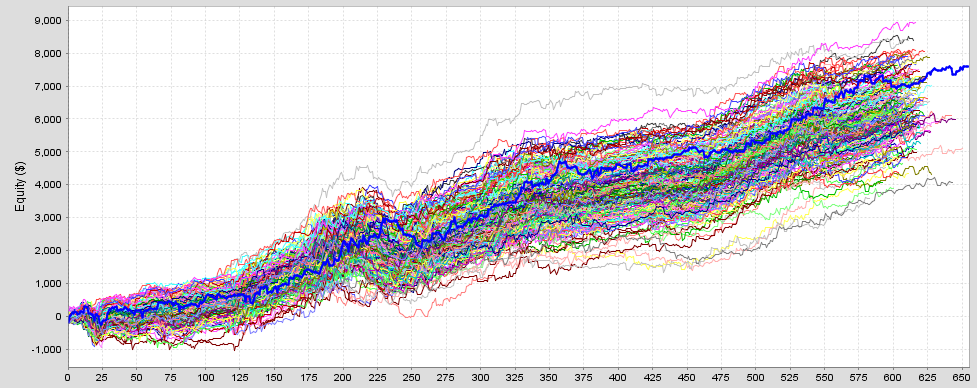
Monte Carlo robustness simulation
Walk-forward testing and optimization
The outcome of systems that passed the above stages can then be taken and optimized. The purpose of optimization is to find the best possible settings in the algorithmic computation or to simply get better results by testing the systems with adjusted logic. One needs to be careful not to re-optimize the initially profitable system as this could result in something called “curve-fitting”. Curve-fitting means that the equity of the system as tested on the primary in-sample data is then excessively optimized to smoothen the swings in the strategy. Such over-optimized systems look good on the historical data, but most often fail in the real market environment. The walk-forward testing can help ensure that the systems will have higher chances to succeed in the future as the methodology takes into consideration the shifts of data between in-sample and out-of-sample, i.e. the historical data based on which the strategy was initially developed and the data sample where the strategy was not yet tested. A good system or strategy should withstand the unknown data and progress similarly to the developing sample.
What next?
Now you have a pool of systems that should be strong enough and robust and should survive any possible market impacts. It is also important to have the portfolio diversified into more instruments so that you don’t face a high risk of relying on one or two particular markets. The portfolio of robots should also account a reasonable number so that you don’t expose your entire equity to a tiny fraction of otherwise strong enough portfolio. In other words, the more robots diversified into different assets, the better. You can now deploy your systems to the trading platform and monitor the performance. It goes without saying that having a proper Trading journal is a necessity. You need to supervise your systems and make sure that they run according to the logic that was developed. You now become a manager controlling your own soldiers.
Our real-time, one-year testing
We wanted to see for ourselves if Algorithmic trading works or not. The above development process took us a whole 4 months of continuous work, testing, retesting, robustness testing, optimization, etc.. The computer was running non-stop as we worked around the clock developing and filtering strong systems. In the end, we’ve had a portfolio of 91 systems that we deployed on 01 Apr 2018 to live trading. The MetaTrader platform looks like this:
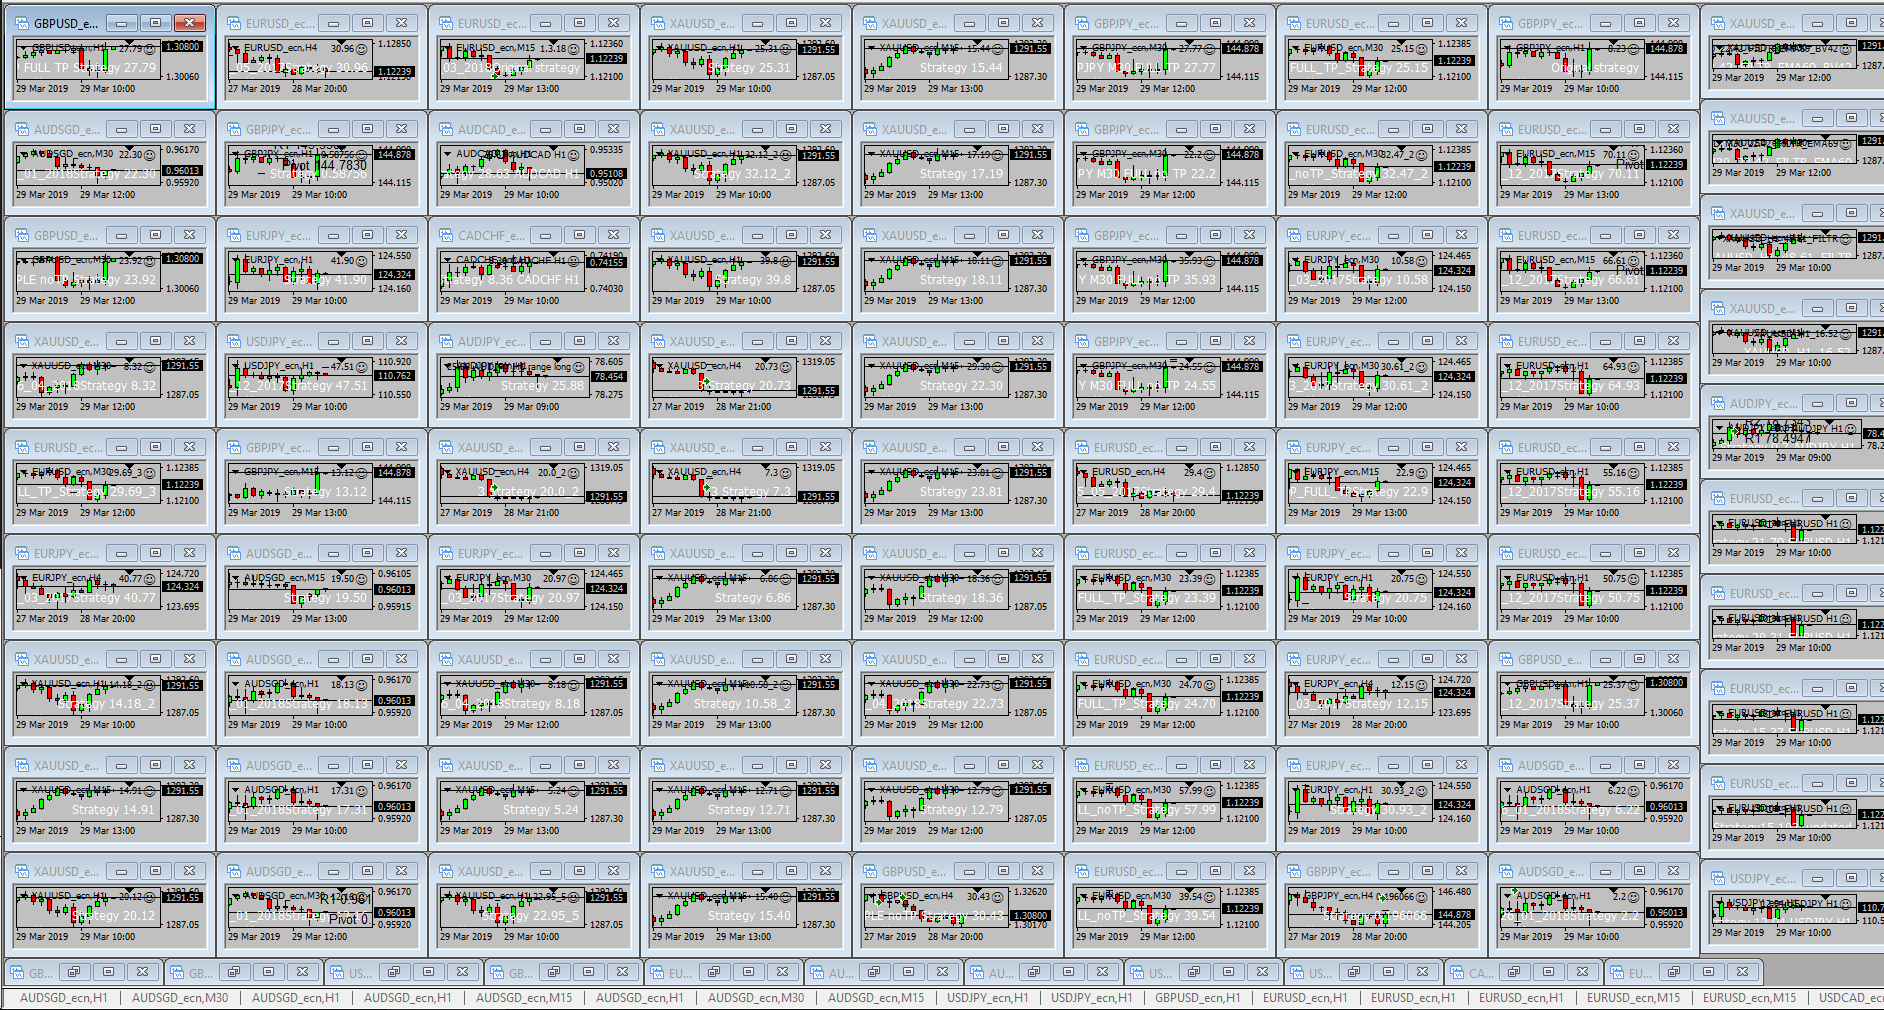
The robots worked in the background and were executing trades as expected. There was no flaw in the system and all individual systems performed as per the underlying strategy logic. During one year of testing, the server crashed 6 times, shutting down the platform for a couple of minutes. This, however, should have no effect on the overall performance of the whole portfolio as these minor outages were supposed to be taken into account during robustness testing and in no way should endanger the profitability of the system. Wondering how does the portfolio perform after exactly one year?
Results
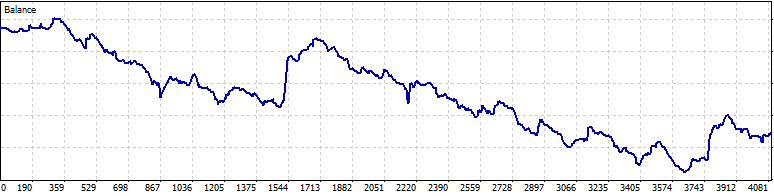
During one year of trading, the results turned out bad. To be specific, there was an overall loss of $12,530 on the $100,000 account. The money management was static and every single trade was executed with 0.1 lots so that we ensure the longevity of the account and maintain good risk parameters. Since every single trade was a new unique trading opportunity, the probabilities for winning were always the same. All trades had Stop Loss and Profit Target in place. Although we have lost 12,5% of the account, this long-term test gave us a good reason to believe that Algo trading, as developed and tested, isn’t the answer to profitable trading. Nevertheless, we don’t stop here. What is the most important thing to do now is to analyze the trading history in greater details and come up with a solution and a way forward. Although this big test of Algorithmic trading turned out as a fail, we believe that you can build up a profitable Algo-based system.
Analysis
As you can see on the above balance curve, the system wasn’t stable enough. There were significant up & down swings and the maximum drawdown at one point in time was 17.6%, which we consider too high. Total trades taken was 4081, which makes it 11 trades per calendar day. Since the entire portfolio has 91 robots, it means that 8.27% of the robots created some result every day. The other algos were idle waiting for the setup or carrying a position from the past. Considering this, we can say that the portfolio was reasonably active. Following is the summary of some statistics:
| Trades | 4081 | Commissions | -$4112 |
| Profitability | 40% | Avg.Trade Length | 1 day |
| Lots | 411 | Profit Factor | 0.87 |
Since the entire portfolio was built upon different instruments and time frames, we can segregate the results according to individual symbols.
| Currency | Long Trades | Long Pips | Long Profit | Short Trades | Short Pips | Short Profit | Total Trades | Total Pips | Total Profit |
| EURUSD | 410 | -1966.0 | -2923.34 | 541 | 1598.4 | 1225.09 | 951 | -367.6 | -1698.25 |
| EURJPY | 177 | -1903.6 | -2037.46 | 149 | 1145.4 | 873.24 | 326 | -758.2 | -1164.22 |
| GBPJPY | 221 | -1124.2 | -1251.41 | 211 | 1522.6 | 824.67 | 432 | 398.4 | -426.74 |
| USDJPY | 120 | -130.1 | -227.06 | 101 | 395.4 | 213.04 | 221 | 265.3 | -14.02 |
| XAUUSD | 488 | -55130.0 | -7269.63 | 532 | 7731.0 | 159.36 | 1020 | -47399.0 | -7110.27 |
| AUDJPY | 126 | 24.8 | -86.52 | 8 | 79.6 | 57.26 | 134 | 104.4 | -29.26 |
| AUDCAD | 5 | -11.7 | -12.59 | 3 | -37.3 | -32.78 | 8 | -49.0 | -45.37 |
| USDCAD | 10 | -21.5 | -31.43 | 13 | -274.4 | -155.69 | 23 | -295.9 | -187.12 |
| CADCHF | 17 | -76.1 | -89.34 | 23 | -125.6 | -167.35 | 40 | -201.7 | -256.69 |
| GBPUSD | 111 | -849.7 | -1057.65 | 117 | -60.3 | -178.54 | 228 | -910.0 | -1236.19 |
| AUDSGD | 0 | 0.0 | 0 | 712 | 248.5 | -550.26 | 712 | 248.5 | -550.26 |
From what we see in the above table, it is clear that all instruments printed losses in total. However, we have sorted the instruments that were profitable and we can see that total of 6 instruments were profitable when selling only. We will now ignore the last three instruments as their Profit isn’t relevant to the cost – commissions. Only the first three symbols generated a reasonable sample size and the profit relevant to their performance.
What next?
There are two scenarios on how we can move forward from here. The first one is that we plug only the profitable systems, meaning shorting EURUSD, EURJPY, GBPJPY and the second scenario is to plug the entire portfolio to a reversal trading and observe the performance in the long run. If the entire Algo based portfolio turned out as a losing system, reversal trading should, in theory, turn out profitable. Will it? Let us know what you think. In the meanwhile, we will engage both scenarios as we are keen ourselves to know the outcome. And you can look forward to another experiment article where we’ll bring you those results.


- As many Free Trials as you need
- Up to $200,000 account
- No time limit

Worldwide Reviews