


Trading the Woodies CCI System – COMPLETE Guide

In this new series we will focus on the popular Woodies CCI system. The system presented in this series will follow the rules set by Ken Wood and his followers.
This series will cover the following chapters:
- Introduction to Woodies CCI
- Presentation of used indicators
- Trend signals
- Exit trade rules
- Counter-trend signals
- Conclusion
In this article we will cover the first two topics. Let’s get started.
Introduction to Woodies CCI
The Woodies CCI system has been named after its founder, Ken Wood, who, thanks to the popularity of this system, has become one of the world’s most famous traders. The popularity of this system was mainly due to the fact that Ken Wood and his followers precisely defined the rules of the whole system. The trader therefore gets a complete system. After reading this manual, you’ll get exact rules for entering both trend and counter-trend signals. You’ll also get exit rules for trend and counter-trend signals, more importantly you will also get information when it is good to do not trade at all. The followers of Ken Wood have proven that the system can be traded in all markets and all time frames. Ken Wood has also set up his own site where he teaches the system. You can find this site here. Ken Wood points out that without sufficient screen time, the trader will not be profitable. You need to get a feel for the system and especially a sense for the early recognition of the chop.
Presentation of indicators.
The Woodies CCI system consists of several indicators, which can be downloaded for MT4 platform here.
The heart of the entire system is the CCI (Commodity Channel Index) indicator created by Donald Lambert in 1980. The aim of the CCI indicator is to help trader to identify potential levels, where a new trend might start. In general, the CCI indicator compares the current price with the average price for the selected period. The value of the CCI indicator will be relatively high when the current price is high above its average price over a given period. Before we move on to the definition of indicators, we need to clarify the calculation of the CCI indicator. Thanks to the knowledge of the formula, we can get the feeling for this indicator faster, which we will use to identify the chop.
- CCI = (Typical price – 20SMA) / (Constant x Mean Deviation)
- Typical price = (High + Low + Close) / 3
- SMA = 20-day simple moving average constructed from a typical price.
- Mean Deviation = Sum of differences between the Typical price and SMA in absolute value. It’s all divided by 20.
- Constant = 0.015. It serves to make 70-80% of all CCI values within the range of +/- 100.
For a better undestanding, we also include the calculation of CCI in Excel. Download here.
Now let’s look at all of the system components:
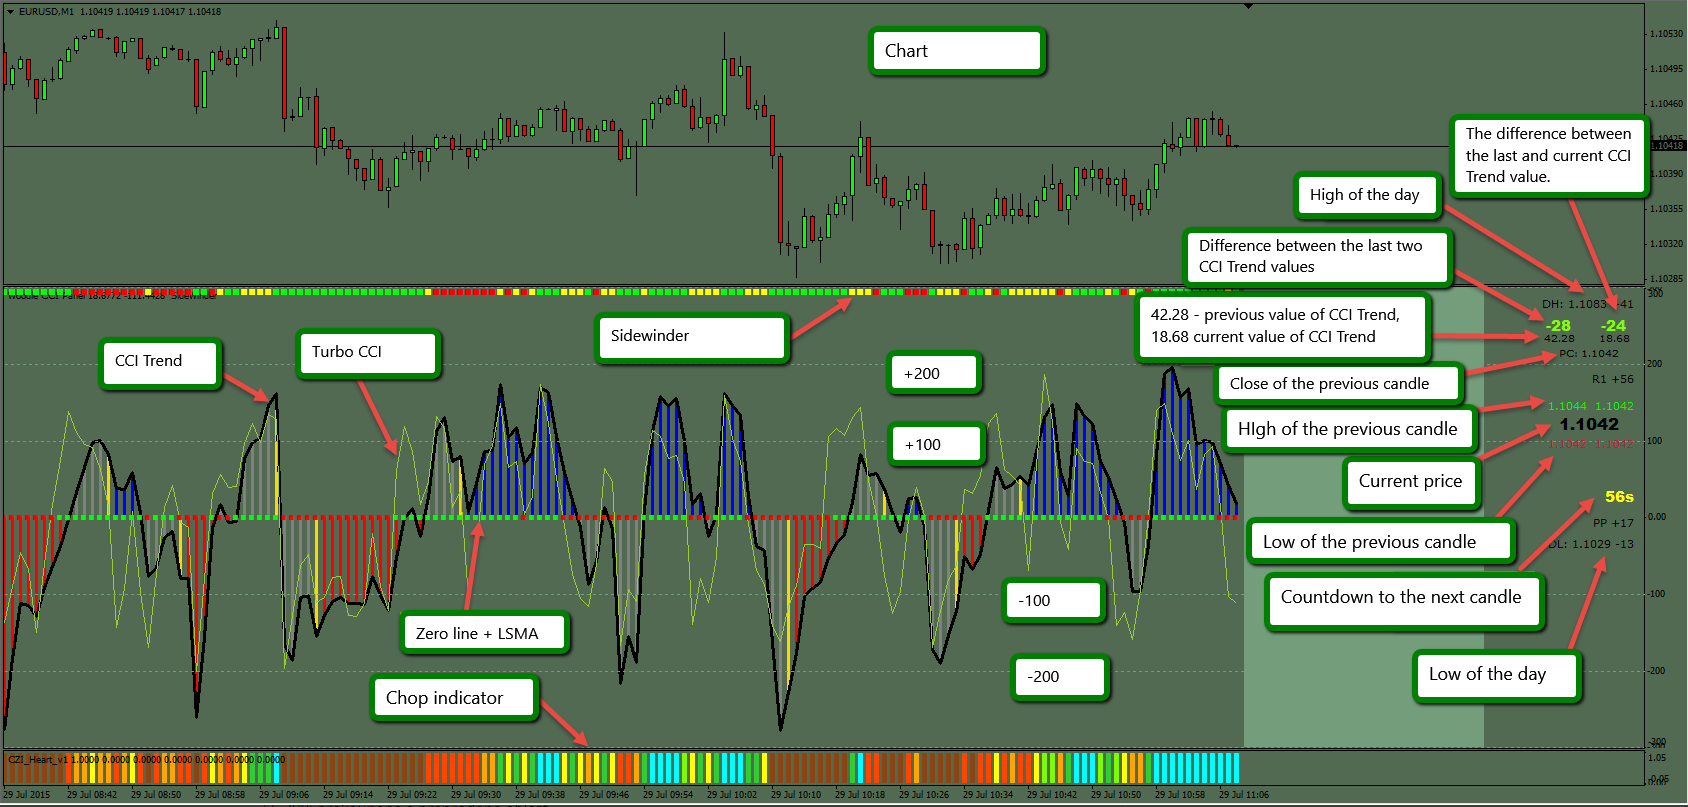
Woodies CCI indicators
- Trend CCI: Is used to determine the trend as well as to determine entry signals. Ken Wood recommends setting CCI with period of 14 for time frames, shorter than 60 minutes and a period of 20 for time frames higher than 60 minutes.
- Turbo CCI: with period 6
- Zero Line: Main support and resistance level.
- +/- 100: minority support and resistance level.
- +/- 200: oversold and overbought areas.
- LSMA: Least Squared Moving Average with a period of 25.
- Chop indicator.
- Sidewinder indicator.
Trend definition
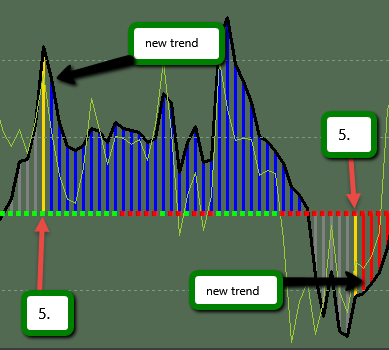
For the trend definition, we only use the CCI Trend. Therefore, we do not use higher time frame. Note that CCI Trend warns us of an approaching trend with a yellow line, which marks the trend change.
- Definition of up trend:
- Six lines above the Zero-Line
- Definition of short tend
- Six lines below the Zero-Line
Supportive trend indicators
Supporting indicators for trend definition:
LSMA:
Green: up trend
Red: short trend
Chop Indicator:
Blue: up trend
Red: short trend
Many colors: Chop
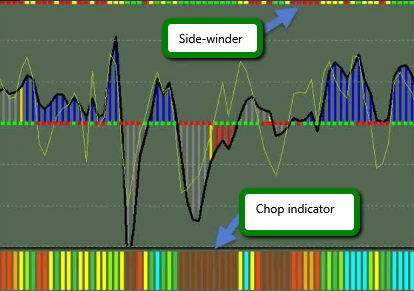
Sidewinder: measures trend strength for both up and short trends.
Green: Strong trend (up and short trend)
Yellow: The trend is not very strong
Red: Weak trend
Chop definition
CCI crosses the Zero-Line at an increased frequency.
Sidewinder is red.
Chop indicator: multiply colors.


- Autant de Free Trials que vous le souhaitez
- Jusqu’à 200 000 $ de compte
- Aucune Limite de Temps

Worldwide Reviews