


Market Profile, Volume Profile et Auction Market Theory
Théorie Auction Market tente de décomposer l’objectif principal du marché et la manière dont les acteurs du marché interagissent pour atteindre cet objectif. Le seul objectif du marché est de faciliter les trades par le biais de ce que l’on appelle le processus de double enchère.
L’une des choses que les traders disent souvent, et qui est complètement fausse, lorsque le marché évolue rapidement dans une direction, c’est que cela s’est produit parce qu’il y avait plus d’acheteurs que de vendeurs. Ce n’est pas vrai, car pour chaque acheteur, il doit y avoir un vendeur et vice versa.
Lorsque le prix augmente ou baisse, il n’y a pas de suprématie d’un côté ou de l’autre, mais le degré d’agressivité ou la volonté d’acheter ou de vendre à des prix plus élevés ou plus bas.

En d’autres termes, le marché est toujours à la recherche de valeur sur la base de la dynamique de l’offre et de la demande. Cela ne vaut pas seulement pour les marchés financiers, mais aussi pour d’autres marchés.
Si l’on suit cette logique, il est facile d’illustrer le cours des actions.
Supposons que l’action Apple se trade actuellement à 100 dollars.
Le nouvel iPhone sort et c’est la catastrophe, la batterie ne fonctionne pas, l’appareil ne cesse de s’éteindre, etc.
À la suite de cet événement, l’action Apple commence à perdre de sa valeur jusqu’à ce qu’elle trouve de nouveaux acheteurs au moins au prix de 80 dollars par action.
C’est là que la nouvelle zone de valeur est créée.
Parfois, les iPhones sont réparés, ce qui signifie que les acheteurs commencent à revenir sur le marché.
Où le marché est-il susceptible de s’arrêter ? La zone de valeur précédente se situe autour de 100 dollars.

C’est finalement ce que fait chaque marché, les participants tradent les prix entre des valeurs équilibrées et déséquilibrées.
La théorie des marchés aux enchères définit une zone où 68 % du volume a été tradé comme une zone de valeur.
La théorie des marchés aux enchères repose sur trois éléments clés :
Prix – Annoncer une opportunité sur le marché
Temps – Réguler les opportunités de prix
Volume – Mesurer le succès ou l’échec de l’enchère. Le volume est variable et représente l’interaction des acteurs du marché à différents niveaux.
Pour résumer la théorie des enchères, il faut toujours comprendre le contexte d’un marché donné.
Le prix est-il équilibré ou déséquilibré ?
La règle générale est qu’une fois que le marché se situe à l’intérieur de la valeur, il est plus probable qu’il reste en équilibre et qu’il explore à l’intérieur du range de la valeur.
Mais si le marché est en déséquilibre, il dérivera souvent à la hausse ou à la baisse jusqu’à ce qu’il s’arrête, ce qui se produit généralement à l’intérieur d’une zone de valeur précédente.

Introduction au Market Profile
Le concept du Market Profile a été créé au Chicago Board of Trade (CBOT) par le trader Peter Steidlmayer et publié pour la première fois dans les années 1980 sous la forme d’un produit CBOT.
Le Market Profile n’est pas en soi une stratégie autonome, mais une façon différente d’appréhender le marché et de prendre de meilleures décisions de trading.
Ils ont considéré un marché comme un processus de vente aux enchères qui est affecté par l’offre et la demande de la même manière que toute autre vente aux enchères, par exemple, l’évolution des prix des denrées alimentaires, du gaz, etc.
Le prix augmente tant qu’il y a des acheteurs sur le marché qui sont prêts à acheter à des prix plus élevés. Le prix augmente jusqu’à ce qu’il y ait au moins un acheteur prêt à acheter à un niveau de prix donné.
Le scénario inverse se produit lorsque le prix baisse, le marché essayant d’attirer des vendeurs disposés à vendre à des niveaux de prix inférieurs, ce qui est intéressant pour les acheteurs.
Avec cette description simplifiée, il est important de réaliser que dans chaque trade, il doit y avoir un trader qui achète et un autre qui vend en même temps pour que le marché bouge.
Lorsque le prix monte ou descend, il n’y a pas de suprématie d’un côté ou de l’autre, mais le degré d’agressivité ou la volonté d’acheter ou de vendre à des prix plus élevés ou plus bas.
Le facteur suivant pris en compte par les créateurs de Market Profile est le fait que le marché est guidé par des schémas répétitifs dans le comportement des acteurs du marché, qui sont les mêmes sur tous les marchés, qu’il s’agisse d’actions, de contrats à terme ou de Forex.
Cela signifie que le Market Profile est applicable à tous les marchés de votre choix.
Pour cette raison, le Market Profile n’a pas de règles strictes. Nous considérons le Market Profile comme l’approche principale et c’est à chaque trader de décider comment il/elle va utiliser cette technique.
Depuis sa première version dans les années 1980, le Market Profile a évolué de manière à pouvoir réagir aux changements de l’environnement de trading.
La mondialisation et l’électronisation des marchés ont eu pour effet de réduire l’impact des sessions de trading en tant que facteurs majeurs de distribution des profils, et la raison en est que l’on peut trader de n’importe où dans le monde et à n’importe quelle heure de la journée.
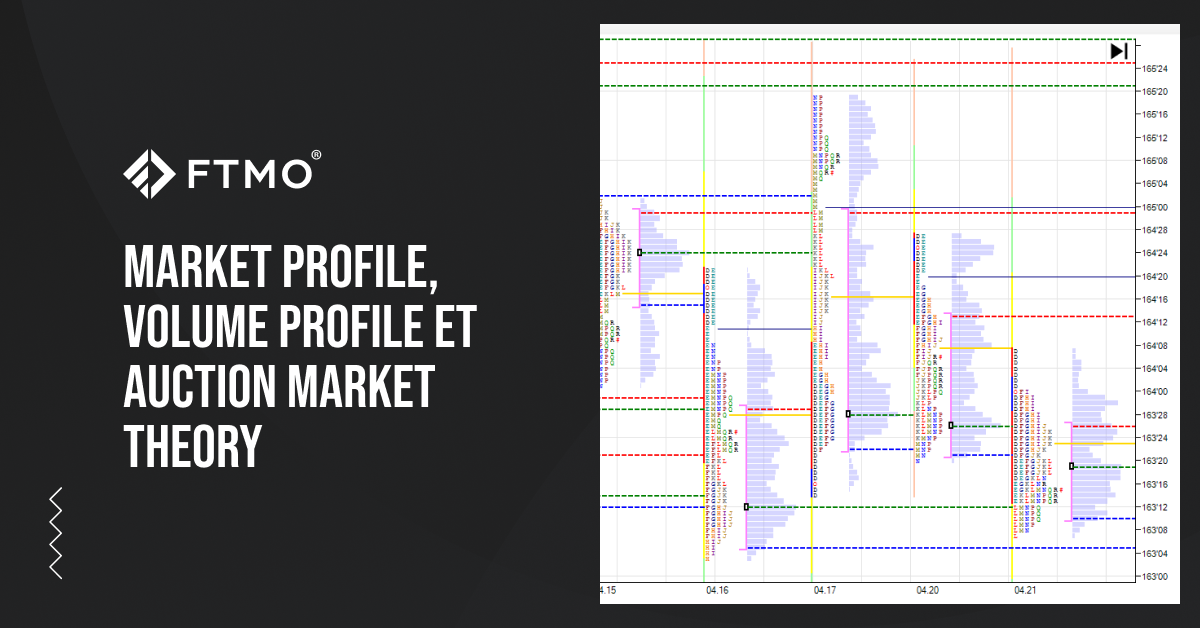
Market Profile – Représentation graphique
Le Market Profile organise des sessions de trading séparées en fonction de ce que l’on appelle des profils, au lieu de représentations graphiques classiques.
L’image ci-dessous montre un exemple de l’écran du trader Market Profile.

L’axe des Y représente un prix tandis que l’axe des X représente le temps.
C’est quelque chose que nous pouvons également voir sur nos graphiques en chandeliers, mais sur le Market Profile, le temps est représenté sous la forme d’une distribution séparée, dans ce cas, les sessions par les heures de trading régulières du produit.
Chaque session est représentée par le TPO (Time Price Opportunity) sur le côté gauche et le VPO (Volume Price Opportunity) sur le côté droit.
Ce que nous voyons est un graphique tridimensionnel affiché dans un espace bidimensionnel.
Discutons d’abord des TPO.
TPO (Time Price Opportunity – Market Profile)
Dans une session de trading, le temps n’est pas séparé par la position des éléments, mais seulement par une séparation typographique pour les différentes périodes de trading.
Le principe du TPO peut être représenté par cette image.
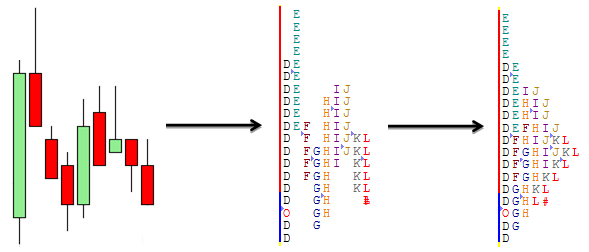
L’image de gauche est un graphique typique sur 30 minutes. Les bougies individuelles sont remplacées par des lettres de l’alphabet anglais, dans l’exemple ci-dessus – commençant par la lettre D (image au milieu). La lettre O dans la première période souligne le prix d’ouverture et le symbole # dans la dernière période représente le prix de clôture.
À la fin de chaque session, toutes les lettres s’alignent de manière à ce qu’il n’y ait plus d’espace entre elles.
De cette manière, le Market Profile (dernière image à droite) est terminé.
À partir du profil TPO, nous calculons le POC (point de contrôle) – ligne avec le plus grand nombre de chiffres et la VA (zone de valeur) – 70 % des lettres autour du POC.
Ces calculs sont également utilisés dans le VPO où la plupart des traders pensent qu’ils trouveront un niveau plus précis basé sur le volume, plutôt que sur le temps comme c’est le cas avec le TPO.
VPO (Volume Price Opportunity – Volume Profile)
Contrairement à tout indicateur de volume traditionnel, nous pouvons trouver le VPO sur l’axe Y de notre graphique.
Le volume est affiché et calculé séparément à chaque niveau de prix, ce qui nous permet de déterminer plus précisément la juste valeur.

Le Glossaire des Profils

Les Acteurs du Marché et leurs Motivations
Le créateur du Market Profile, Peter Steidlmayer, a commencé à diviser les participants du marché en deux groupes principaux.
Chaque groupe a des motivations différentes et trade sur des périodes différentes et avec des tailles différentes.
Traders Court Terme – STF (Short-Term Time Frame)
Pour Steidlmayer, les traders qui tradent sur de petites time frame sont de petits traders, essentiellement des particuliers, qui souhaitent trader sur une base intra-journalière.
Ils n’ont pas le temps d’attendre des prix favorables et tradent entre eux autour de la juste valeur qui est représentée par le point de contrôle et que les deux parties considèrent comme suffisamment juste pour acheter et vendre.
Ils ne disposent généralement pas d’un capital suffisant pour pouvoir faire bouger le marché.
Pour établir la Balance Initiale (IB), Steidlmayer utilise la première heure de trading après l’ouverture du marché.
Nous utilisons la première heure de la journée de trading (IB) comme point de référence.
Traders Long Terme – LTF (Long-Term Time Frame)
Les traders LTF, qui peuvent également être appelés traders OTF (Other Time Frame), ouvrent généralement leur position pour plusieurs jours, semaines, mois ou années.
Ils peuvent se permettre d’attendre plus longtemps le niveau de prix qu’ils considèrent comme favorable.
En général, ces traders sont appelés Smart Money – banques, hedge funds et institutions qui disposent d’un capital beaucoup plus important que les traders particuliers.
De ce fait, ils peuvent ouvrir des positions importantes qui peuvent influencer le prix et créer une dynamique à long terme sur le marché.
La plupart du temps, ils ne peuvent même pas ouvrir le nombre de contrats à un prix donné, ils doivent donc constituer lentement leurs positions, ce qui prend souvent plusieurs jours et entraîne une tendance sur le marché.
Market Profile – Types de Distribution
Pour pouvoir trader les Market Profiles de manière efficace, nous devons séparer les jours de trading individuels en catégories basées sur le solde initial de la session.
L’analyse du solde initial pour chaque jour peut aider le trader à prendre des décisions au cours des heures de trading ultérieures.
La balance initiale est principalement utilisée dans le trading à terme, le Forex étant un marché fonctionnant 24 heures sur 24, mais elle fait toujours partie intégrante du trading de Market Profile, et tout trader souhaitant maîtriser le concept doit la connaître.
Les exemples que vous allez voir sont représentés avec le Market Profil et le Volume Profile l’un à côté de l’autre. L’IB est marqué d’une ligne noire sur le VPO et d’une ligne verticale bleu-rouge dans le cas du profil TPO.
Journée normale
Le nom de cette journée peut être trompeur car il est très rare de voir cela dans les transactions quotidiennes.
Cette journée se caractérise par le fait que l’IB est plus large que d’habitude et qu’il n’a pas été dépassé pendant toute la journée.
Grâce à cela, nous pouvons dire que les OTF sont entrés sur le marché dans la première heure et qu’ils n’y participent plus.
Les traders à court terme et les scalpeurs sont très actifs, mais ils n’ont pas assez de force pour faire bouger le marché.

Une variante de la Journée Normale
Il s’agit du type de distribution le plus typique. Il se caractérise par le fait que l’IB de taille normale n’est rompu que dans une seule direction.
La rupture de l’IB d’un seul côté signifie que l’OTF est entré sur le marché et tente de faire bouger le prix en dehors de l’IB.

Jour de Tendance
Les caractéristiques de ce jour sont que l’OTF contrôle le marché de l’ouverture à la fermeture.
Le jour de tendance se produit lorsque l’IB est cassé au moins 2 fois par rapport à l’IB normal.
Cela se produit lorsque la juste valeur du marché change.
En raison des mouvements brusques, le marché laisse des zones de nœuds à faible volume, qui tendent à être testées dans les jours à venir.

Double Distribution
La Double Distribution se manifeste par un changement rapide d’une zone de valeur au cours d’une journée, et cela se produit souvent pendant les nouvelles à fort impact.
Un mouvement rapide de la valeur entraînera la fin d’une distribution, la rupture de l’équilibre initial et la création d’une nouvelle distribution de l’autre côté du profil.
Ce que l’on peut voir à la fin de la journée, ce sont deux distributions équilibrées avec d’importantes zones de nœuds à faible volume.
Journée Neutre
Comme pour la Journée normale, nous avons une balance initiale prolongée.
Si le prix dépasse le sommet de l’IB, il attirera rapidement les vendeurs qui ramèneront probablement le prix au point de contrôle ou au point bas de l’IB.
Une fois que les vendeurs se situent en dessous du point bas de l’IB, le prix s’inverse rapidement et le marché finit par clôturer à l’intérieur du range de l’IB.

Journée Neutre – extrême
Ce jour-là, l’IB est également dépassé des deux côtés, mais le marché clôturera en dehors du range de l’IB à la fin de la journée.
Cela signifie qu’un côté de l’OTF a été plus agressif.

Jour sans Tendance
Représenté avec un IB très serré.
Il est possible de ne pas trader pendant les jours fériés ou d’attendre les nouvelles à fort impact.

Types d’Ouverture
Avec le trading Market Profile, nous définissons quatre types d’ouverture en fonction de la journée précédente.
La capacité à identifier le type d’ouverture précoce aide le trader à définir son biais pour la journée.
Open-Drive (OD)
On parle d’open-drive lorsque le prix commence à évoluer dans un sens immédiatement après l’ouverture du marché.
Dans ce cas, le prix d’ouverture peut être le plus haut ou le plus bas de la journée.
Ce type d’ouverture nous signale qu’il n’est pas judicieux de contrer la tendance et qu’il est bien plus intelligent d’attendre les replis et de trader avec cette tendance.
L’Open-Drive nous donne une forte conviction que la juste valeur du prix change rapidement et que nous entrons dans un marché en tendance.

Open-test-drive (OTD)
Open-test-drive est un type d’ouverture plus habituel lorsque le marché est sur le point de tester un niveau significatif de la veille.
Nous observons la réaction du POC de la veille, de la zone de valeur basse et de la zone de valeur haute.

Open-rejection-reverse (ORR)
Comme pour l’OTD, nous pouvons observer une ouverture dans une direction, mais un rejet brutal à partir d’un point.
La différence entre l’OTD et l’ORR est que l’ORR vise généralement des niveaux plus élevés avec beaucoup de liquidité.

Enchères Ouvertes (Open-Auction)
L’Open-Auction signale un équilibre entre les acheteurs et les vendeurs.
Dans cette situation, les participants du marché se sont mis d’accord sur une valeur équitable pour toute une journée de trading et le prix rebondit généralement à l’intérieur de la zone de valeur de la veille.
Le volume sur le marché du Forex
Les informations sur le volume réel sont disponibles sur les différentes places boursières et ne sont pas gratuites.
Beaucoup de traders diront qu’il n’y a pas de volume sur le Forex puisque vous êtes sur le marché OTC (Over the counter) qui n’a pas de marché central et qu’il n’y a pas de standardisation dans le volume et l’expiration.
C’est vrai, mais dès que vous afficherez le volume d’un CFD, vous verrez ce chiffre dérivé sur l’axe des x sous la forme d’une fenêtre contextuelle de volume. Maintenant, comparons-le avec le volume réel.

Le graphique ci-dessus montre les CFD pour le Pétrole (Crude Oil) sur la plateforme MT4, du 1er novembre 2013 au 13 août 2015. L’histogramme montre les changements de prix sur des périodes quotidiennes.

Dans le graphique ci-dessus, vous pouvez voir le graphique des contrats à terme sur le Pétrole (Crude Oil) à la bourse CME du 22 octobre 2013 au 13 août 2015.
L’histogramme montre la valeur des contrats réels tradés pendant les heures d’ouverture du marché.
Comparons ces deux histogrammes côte à côte.
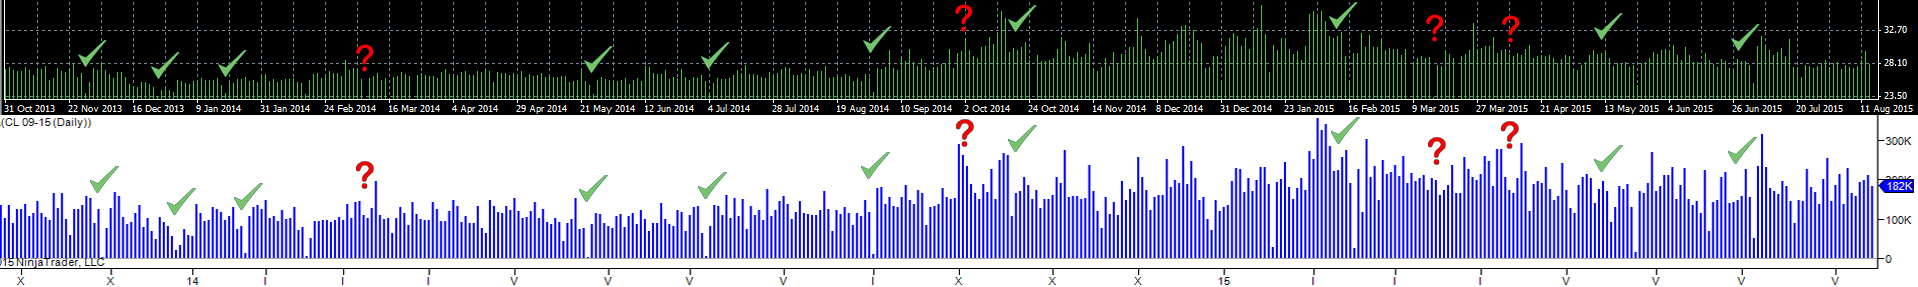
Les volumes marqués d’un crochet sont plus ou moins identiques. En revanche, les volumes marqués d’un point d’interrogation sont significativement différents.
L’exemple ci-dessus montre qu’il n’y a pas de corrélation parfaite, mais que les volumes sont plus ou moins identiques.
Les volumes des contrats à terme sont plus détaillés, mais il n’y a aucune raison de se désintéresser des volumes lorsque l’on trade des contrats CFD.
Indicateurs Market Profile pour MetaTrader4
Ces indicateurs ne sont pas créés par l’équipe FTMO et nous ne sommes pas responsables des éventuelles erreurs de trading. De plus, ces indicateurs peuvent ralentir votre plateforme de trading, nous ne recommandons donc pas de les utiliser en période d’exécution.
+TPO
Vous pouvez facilement définir les données que vous souhaitez analyser.

ay-MarketProfileDWM
Affiche le profil de chaque jour de trading avec la zone de valeur.

Market Statistics
Cet indicateur est construit en fonction du temps et du Price Action plutôt que du volume réel.

TPO-Range
Vous pouvez facilement définir le range que vous souhaitez analyser
Market Profile dans le trading Forex
Nous conclurons cet article par quelques exemples concrets sur le marché du Forex, afin de démontrer à quel point le Market Profile peut être bénéfique pour vos transactions quotidiennes.


- Autant de Free Trials que vous le souhaitez
- Jusqu’à 200 000 $ de compte
- Aucune Limite de Temps

Worldwide Reviews