
High RRR Across Markets: How Diversity Delivered a 23% Profit
In this edition of Successful Trader Stories, we look at a trader operating a global FTMO Account who generated a solid $23,542 profit. Instead of focusing on a single instrument, he searched for high-quality setups across multiple markets, including gold, forex pairs, indices and even crypto over the weekend. This broader approach provided more opportunities, but also required greater discipline.
Disclaimer: All information provided on this site is intended solely for educational purposes related to trading on financial markets and does not serve in any way as a specific investment recommendation, business recommendation, investment opportunity analysis or similar general recommendation regarding the trading of investment instruments.
Gradual Growth Built on Selective Setups
The Balance curve shows a cautious start, after which equity began to rise steadily and finished near the highs at $123,542.34, confirming a controlled and methodical trading process.
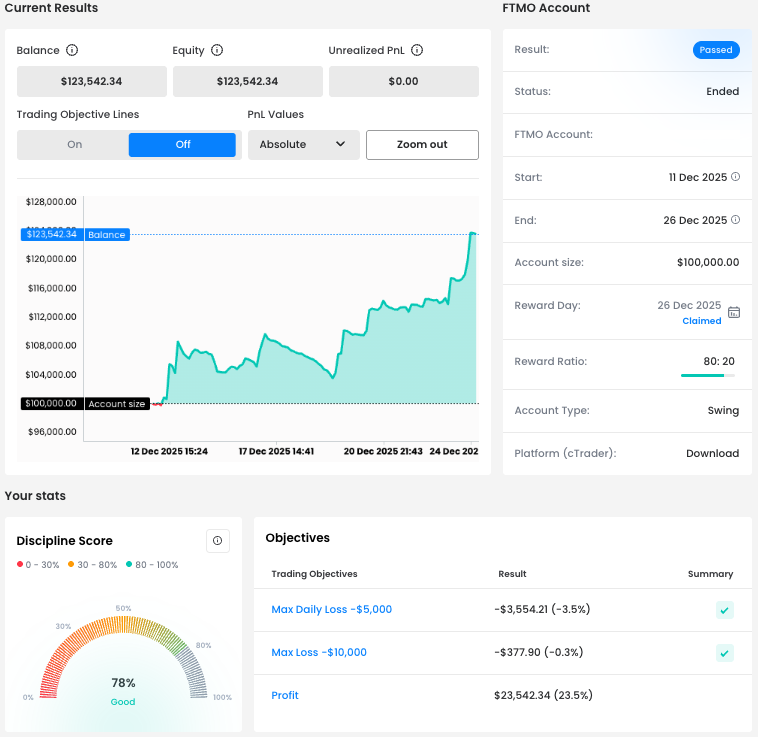
Even during less favourable periods, risk remained under control. The Max Daily Loss was respected throughout the entire period, with the worst day staying clearly within limits. A Discipline Score of 78% supports the idea that this performance was driven by structure, not emotion.

Numbers That Put the Result in Context
One of the first statistics that stands out is the Win Rate of 34.78%. This means that roughly one out of three trades ended in profit. On its own, this may look low, but the broader picture tells a different story.
The key lies in the Average RRR of 4.05, showing that winning trades were, on average, more than four times larger than losing ones. The average profit per trade reached $1,096.45, while the average loss was limited to –$270.87. This combination clearly explains how profitability was achieved despite a lower hit rate.
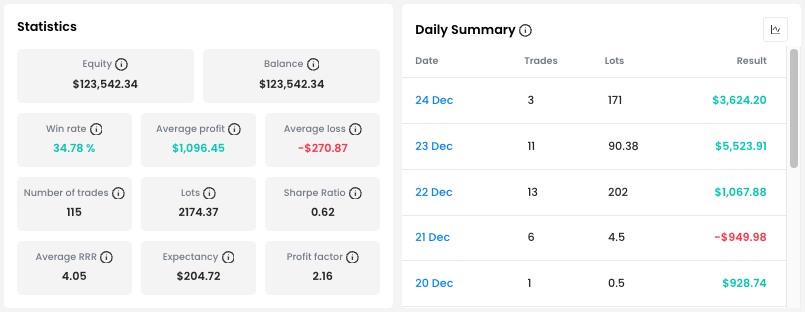
In total, the trader executed 115 trades, demonstrating an active yet disciplined intraday approach with a strong focus on risk-to-reward efficiency.
Trading Across Markets, Not Just One
Unlike traders who specialise in a single instrument, this trader actively searched for ideal setups across multiple markets. His trading activity included XAUUSD (Gold), several forex pairs, indices and even crypto over the weekend. This kind of diversification offers more opportunities, but also requires greater focus and faster decision-making. It is not a universal solution, but for this trader, it clearly aligned well with his strengths and temperament.
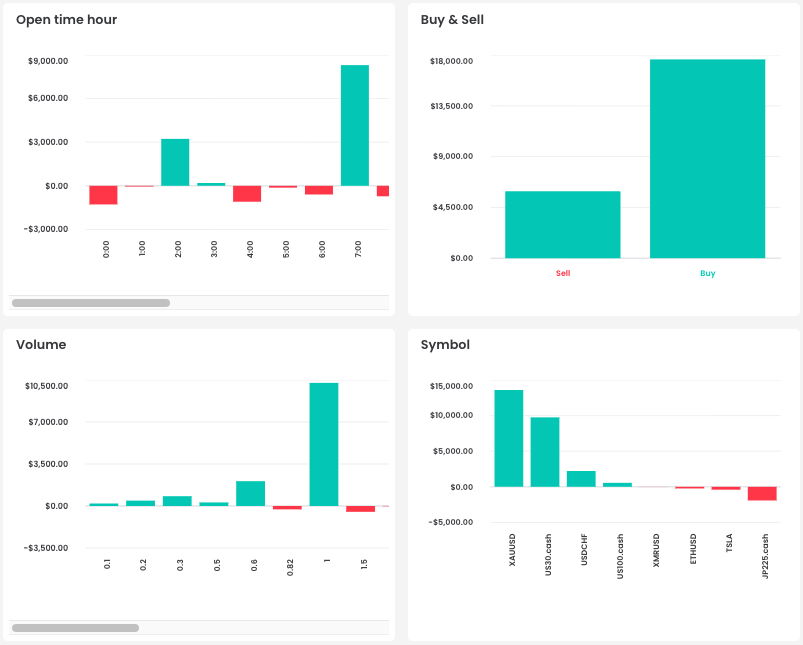
The Buy & Sell breakdown shows flexibility on both sides of the market, confirming that trades were taken based on setup quality rather than directional preference.
Intraday Trading With Scalp-Like Risk Control
Although the trader operated primarily as an intraday trader, many characteristics point toward a scalp-oriented risk mindset. His most successful trades often lasted several hours, while losing trades were frequently closed within seconds or minutes.
This strongly suggests tight Stop Loss placement and quick invalidation when the setup did not confirm. Such behaviour naturally supports a high RRR profile, even at the cost of a lower Win Rate.
A Difficult Day Managed Well
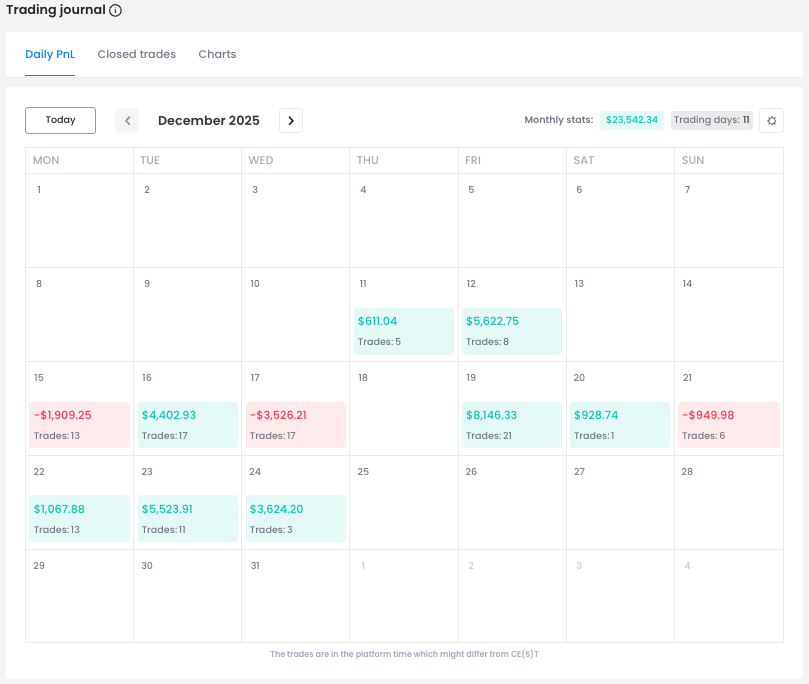
An interesting moment appears on 17 December, when all 17 trades closed in loss, resulting in a total drawdown of $3,526.21 for the day. Despite this rough session, the trader remained well within the Max Daily Loss limit, showing discipline even under pressure.
Rather than trying to recover losses aggressively, he accepted the outcome and protected the account – a key trait of long-term consistency.
Case Study: A $4,866 Gold Trade Held for Almost 24 Hours
The most profitable and longest trade of the period came on XAUUSD, where the trader secured $4,866.44 in profit over nearly 24 hours. The position was opened after price broke above a resistance zone.
While the entry came before a full confirmation, making it slightly riskier, the trader compensated with a tightly placed Stop Loss just below the entry level. The Take Profit was not hit automatically, as the trend reversed sharply, but manual execution protected a large portion of the open profit.
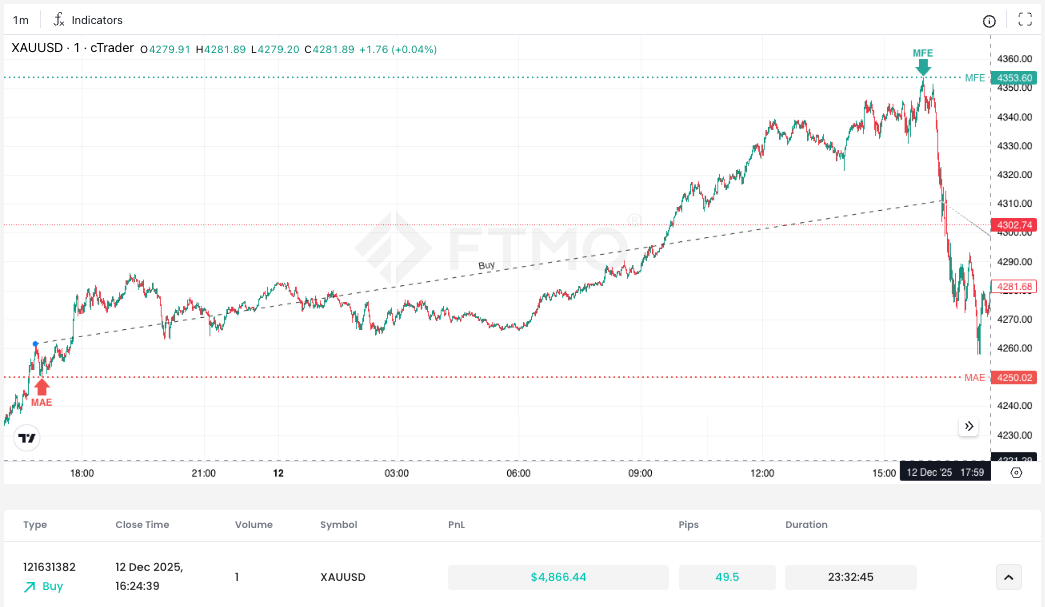
This trade illustrates a balanced mix of confidence, risk awareness and timely execution, even when market conditions changed quickly.
What This Trading Period Shows
This performance highlights that there is no single path to profitability. By combining high RRR, diversified market exposure and strict risk control, this trader turned selective execution into a $23,542 profit.
Once again, this Successful Trader Story shows that long-term results are built on understanding your strengths, adapting your approach accordingly and executing with consistency and discipline.
Note: Since we cannot clearly define the exact trader's strategy from the chart, this is only the private opinion of the author of this article. FTMO Traders are free to choose their strategy and as long as they do not explicitly violate our Terms and Conditions and follow our risk management rules, the choice of strategy and execution of individual trades is up to them.

All information provided on this site is intended solely for educational purposes related to trading on financial markets and does not serve in any way as a specific investment recommendation, business recommendation, investment opportunity analysis or similar general recommendation regarding the trading of investment instruments. FTMO only provides services of simulated trading and educational tools for traders. The information on this site is not directed at residents in any country or jurisdiction where such distribution or use would be contrary to local laws or regulations. FTMO companies do not act as a broker and do not accept any deposits. The offered technical solution for the FTMO platforms and data feed is powered by liquidity providers. This article is for informational purposes only, and some information may not reflect the current service offering or product features. Please always verify the latest terms on the official product pages.
About FTMO
FTMO has developed a two-step evaluation process to find trading talents. Upon successful completion, you may be eligible for an FTMO Rewards Account with a balance of up to $200,000 in simulated funds. How does it work?